
Description
For aspiring price action traders, reading a candle chart at speed can be learnt, but is a skill which takes years to perfect. For lesser mortals, help is required, and this is where the Quantum Dynamic Price Pivots indicator steps in to help.
As a leading indicator based purely on price action, the indicator delivers simple clear signals in abundance, highlighting potential reversals with clinical efficiency. Just like volume and price, pivots are another ‘predictive’ indicator, and a leading indicator of price behaviour. And this is just the starting point for the ‘Swiss army knife’ trading indicator.
Pivot points can then be used to identify congestion phases of price action, dynamically as they are created, as well as define trends, again in real time. And of course, not forgetting possible trading opportunities as well.
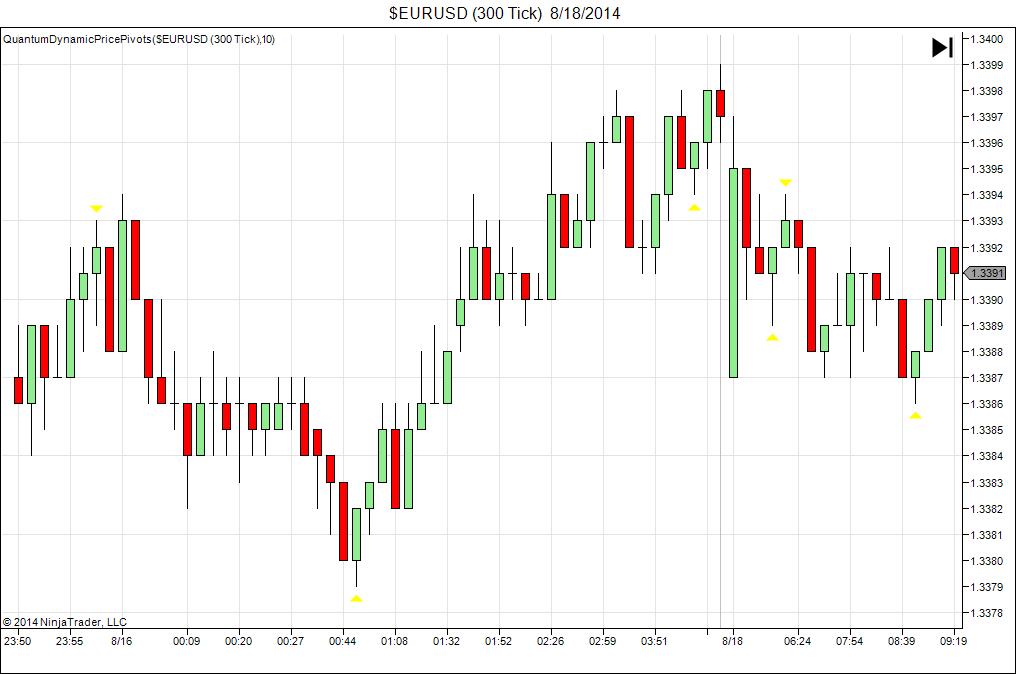
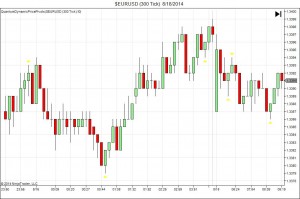
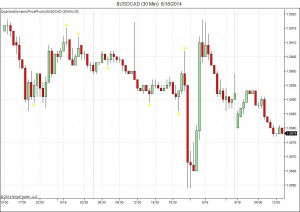
Two specific pivot signals are displayed. A pivot low, and a pivot high. Both are shown with a yellow arrow. The pivot low is triggered on the candle, when the candles or bars either side have a higher high and a higher low than that in the middle. The pivot high is triggered on the candle, when the candles or bars on either side have a lower high and a lower low. These simple phases of price action then signal potential reversals along with pause points into congestion, and the development of longer term trends.
In congestion phases, the pivots mark the highs and lows of the phase dynamically. Typically what happens here is the market moves into a congestion phase following a trend higher or lower. In the case of a move higher, the market reverses lower and a pivot high is posted. The market then finds some support and reverses higher once again, posting a pivot low. These two points then create the upper and lower levels of support and resistance, and if these are further confirmed with a pivot high and low, then this has established a market in a congestion phase and which has been highlighted dynamically and in real time by the indicator.
In the trend phase, again they mark the upper and lower trend lines as the price action develops, and in this case will form higher lows and higher highs marked by the pivots in real time.
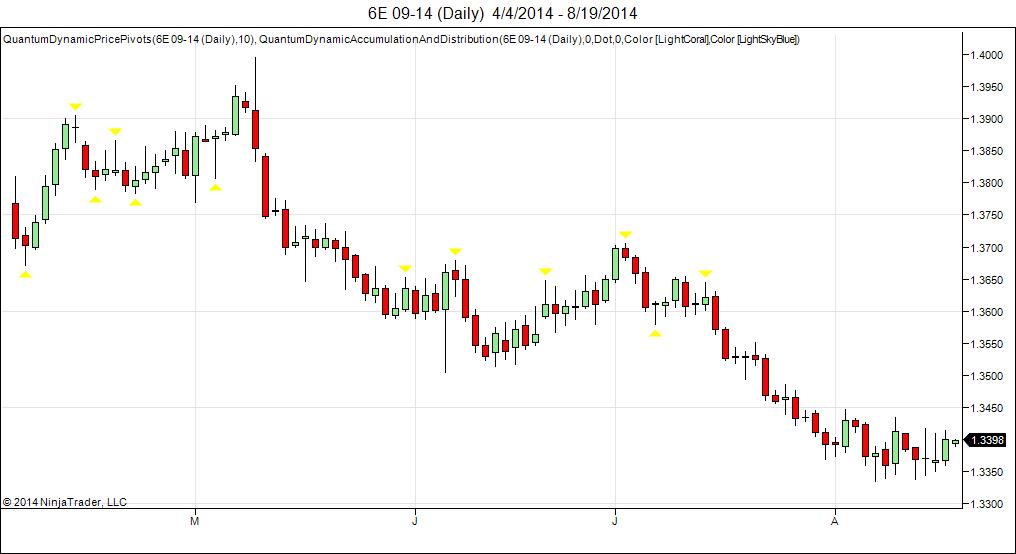
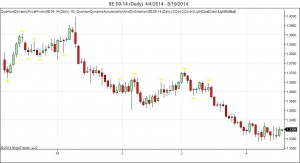
This is why we refer to it as the ‘Swiss army knife’ indicator. Simple and elegant, yet powerful and functional with many uses! And when coupled with the Quantum Dynamic Accumulation and Distribution indicator, really does allow you to take advantage of these key turning points – dynamically.
The Quantum Dynamic Price Pivots indicator works in all timeframes form tick to seconds and from minutes to months.
Get yours today, and take the hard work out of price action trading!