Introduction
Of all the four principal capital markets, the world of foreign exchange trading is the most complex and most difficult to master, unless of course you have the right tools! The reason for this complexity is not hard to understand.
First currencies are traded in pairs. Each position is a judgment of the forces driving two independent markets. If the GBP/USD for example is bullish, is this being driven by strength in the pound, or weakness in the US dollar. Imagine if we had to do the same thing trading stocks for example. Consider trading Google against Amazon. If this ‘pair’ were rising, is this being driven by strength in Google or weakness in Amazon? Almost impossible to analyse.
To compound this problem, every currency can be bought or sold against a myriad of other currencies. This raises the next key question. If the GBP/USD is bullish once again, is the British pound strong against all the other major currencies, such as the GBP/JPY, the GBP/CAD, the EUR/GBP etc. If it is, then this is clearly a sign that the UK pound is being bought universally in the market. Equally for the US dollar, if it is sold universally in pairs such as the USD/CAD, the USD/JPY and others, then we can assume that the GBP/USD is rising as a result of strong buying of the pound universally, and strong selling across the market of the US dollar.
Finally, we come to the third problem, which is trying to assess the strength of this buying or selling. After all a currency may be overbought (strong) or oversold (weak) but how strong is strong, and how weak is weak.
Consider this for a moment. Assume you have decided to buy the GBP/USD and have the following information to help you in your analysis:
- Whether the GBP is also being bought in all the other cross currency pairs
- Whether the USD is also being sold in all the other major currency pairs
- The relative strength of buying in the GBP/USD pair
Trading success is all about assessing risk and the probability of success on each trade. Would this information give you a high risk, medium or low risk trading position? And the answer……… is a low risk trading opportunity. After all, you are now taking a position based on a view across the market.
First, if you are basing your decision on universal buying or selling of a currency, then you are trading with the entire weight of the market, and not just on the analysis of one currency pair – it’s low risk. Second, if you know the relative strength of this buying or selling against all the other currency pairs, then this gives you the complete picture – if its strong, then again – it’s low risk. Third and last, if you know what the counter currency is also doing in terms of strong or weak, then once more if its strong – it’s low risk.
This is where the Quantum Currency Matrix steps in. It provides the solution to all three problems in one elegant indicator. It shows you the complete picture across the market in a simple matrix, which works in all timeframes from 1 minute to 1 month.
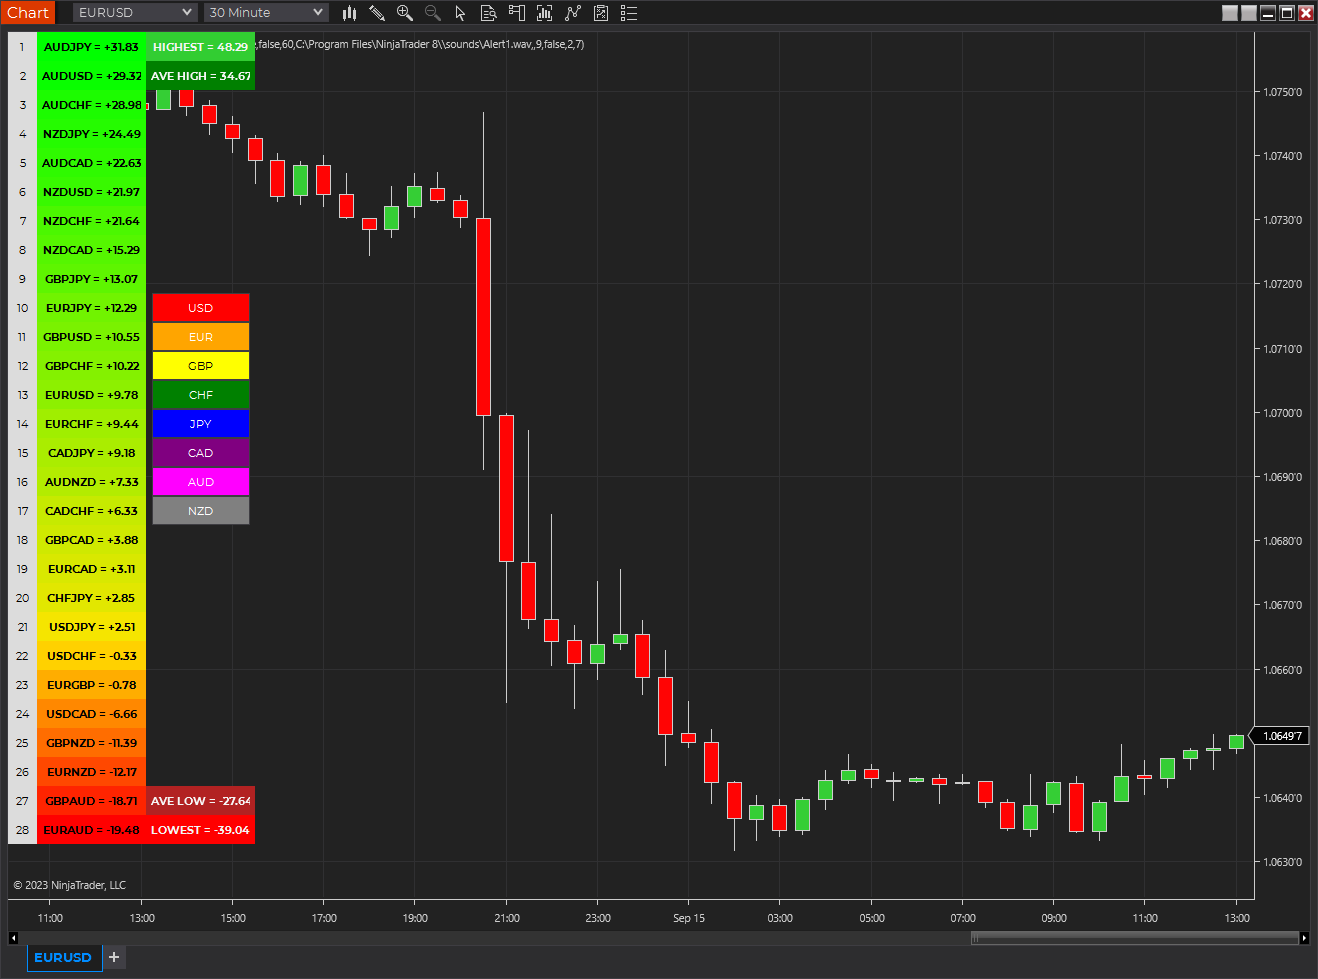
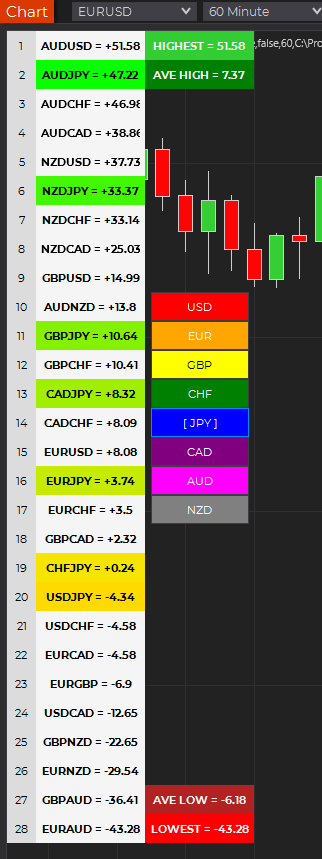
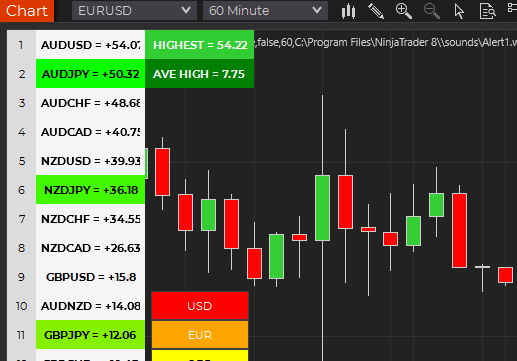
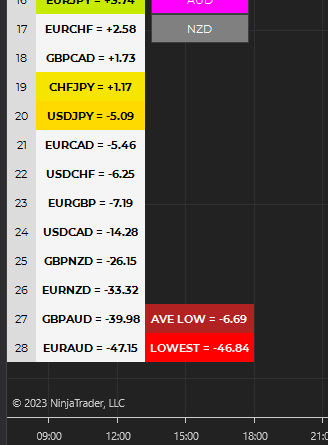
From the eight major currencies come the 28 currency pairs which are then displayed in a table, with their relative strength scores, updated second by second and minute by minute. As you can see, the Currency Matrix displays the complete spectrum of currency pair strength, from very bullish at the top of the matrix and bright green, to heavily bearish at the bottom of the matrix, and bright red. Those currency pairs moving up or down the ladder from bullish to bearish or bearish to bullish are then shaded in the transitional colors of orange, and yellow to light green.
Every pair is displayed with a ranking score. Above 0.00 indicates the pair is moving into a bullish phase, whilst a score below 0.00 indicates bearish momentum is increasing.
Each currency can then be isolated to show the 7 associated pairs and their relative scores. If all the associated pairs are showing similar strength (either bullish or bearish) then this is either a good time to join the move, or alternatively it may be an opportunity to wait for a reversal in trend as the pair becomes overbought or oversold.
The Quantum Currency Matrix gives you the tool to see the complexities of the Forex market in real time across all the related pairs, along with the strength of the buying and selling. Whilst it is possible to do this manually using multiple charts, what a manual matrix will not provide is any measure of the relative strength. The indicator does this for you automatically by considering the price action across all the related currency pairs and then deriving the relative strength scores accordingly. These are the ranking scores which you see displayed on each currency pair and by which they are ranked in the ladder.
Currency filter
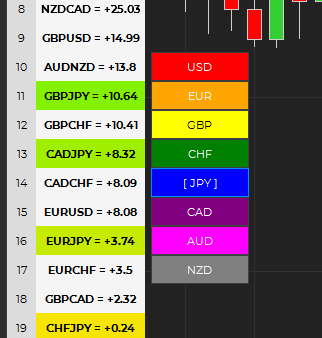
The Currency Matrix indicator allows you to filter the currency pairs relevant to the currency you are analysing. A set of buttons is provided at the right side of the table which you can click to select a currency:
- USD is the red button which filters out and displays all currency pairs containing the US Dollar.
- EUR is the orange button which filters out and displays all the currency pairs containing the Euro.
- GBP is the yellow button which filters out and displays all the currency pairs containing the British Pound.
- CHF is the green button which filters out and displays all the currency pairs containing the Swiss Franc.
- JPY is the magenta button which filters out and displays all the currency pairs containing the Japanese Yen.
- CAD is the purple button which filters out and displays all the currency pairs containing the Canadian Dollar.
- AUD is the blue button which filters out and displays all the currency pairs containing the Australian Dollar.
- NZD is the white button which filters out and displays all the currency pairs containing the New Zealand Dollar.
The buttons work on a toggle basis. Click them once to filter, and then click again to remove the filter. When a currency filter is in effect, the relevant currency pairs in the table appear in color while the others turn white.
Extremes
“How does the strongest and weakest currency pairs in the matrix compared to the past strongest and weakest currency pairs within the period?”
This is the question that the “All time HIGH”, “Average HIGH”, “All time LOW”, and “Average LOW” numbers answer. These pieces of information are found beside the top-most and bottom-most currency pair in the matrix.
The following numbers are found at the right side of the top-most currency pair in the matrix:
- All time HIGH – displays the highest score achieved by a currency pair within the period
- Average HIGH – displays the average highest score achieved by a currency pairs within the period
The following numbers are found at the right side of the bottom-most currency pair in the matrix:
- All time LOW – displays the lowest score achieved by a currency pair within the period
- Average LOW – displays the average lowest score achieved by a currency pair within the period
Currency Dashboard
The Quantum Currency Matrix is a unique indicator. In an instant, you can see which pairs are rising strongly or falling strongly in every timeframe, and on a single chart. Whilst the Quantum Currency Strength Indicator gives you the heads up on individual currency strength and weakness, the Quantum Currency Matrix then delivers the global view for that currency in all the related pairs and for each timeframe – instantly and giving you the tools to trade every pair with complete confidence.
For best results, please use the Quantum Currency Matrix in a forex chart preferably one with high tick rate like EURUSD and other USD pairs. The indicator will work in all timeframes from seconds to minutes, hours and months on the NinjaTrader 8 platform.
When you first apply the indicator, please allow a few seconds for the data to build in history.
By itself, the Quantum Currency Matrix indicator is a powerful trading tool for identifying trading opportunities quickly and easily. However, it was developed as part of what we like to call the Quantum Currency Dashboard which consists of the following indicators:
- Quantum Currency Strength Indicator (CSI)
- Quantum Currency Matrix
- Quantum Currency Array
- Quantum Currency Heatmap
These four indicators then provide a unique and compact insight into all the various aspects of strength and weakness for both currencies and currency pairs, from trend and momentum to overbought and oversold. What is unique is that using four charts, you are then able to monitor the myriad combinations of strength, weakness, momentum, congestion and divergence across the entire forex complex at a click of a button. And even more powerfully, giving you the confidence to get in and stay in for maximum profits. No more missed opportunities, no more struggling with multiple charts, and no more trader regret, whatever your trading style or approach.
Installation
Open your NinjaTrader 8 platform and select a chart.
Right click the chart to bring up a menu which looks like the following image:
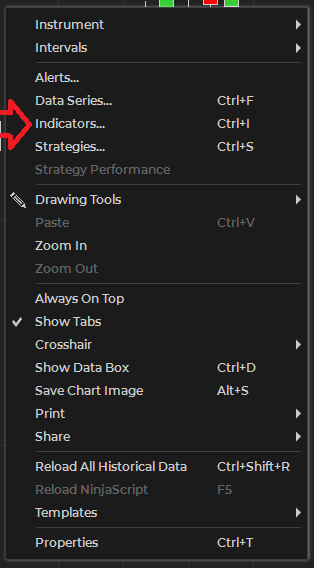
Select Indicators… which will open the following window. Alternatively, you can open this window by clicking the Indicators button in the chart toolbar or by pressing Ctrl + I while focused on the chart.
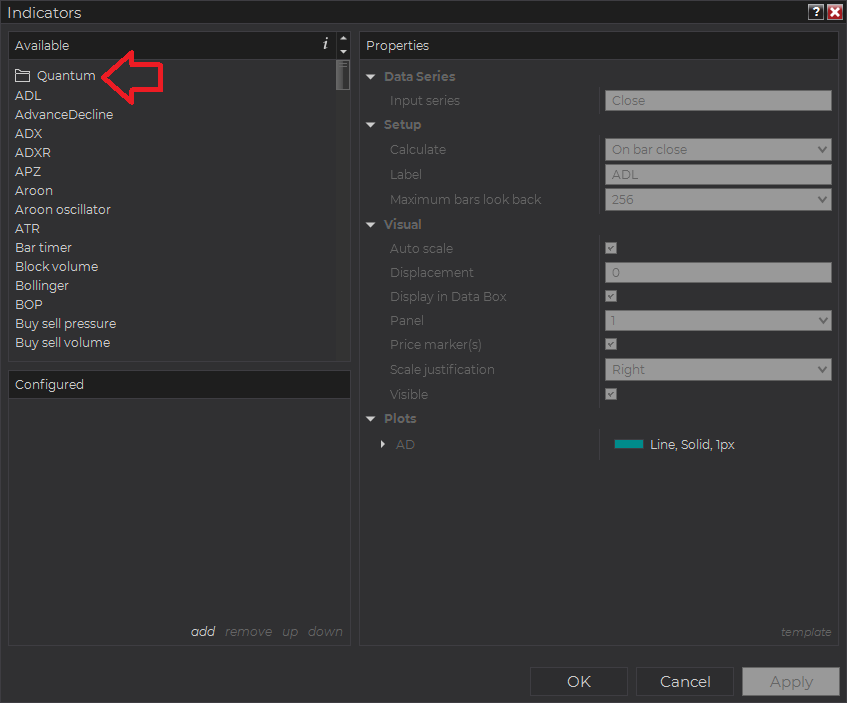
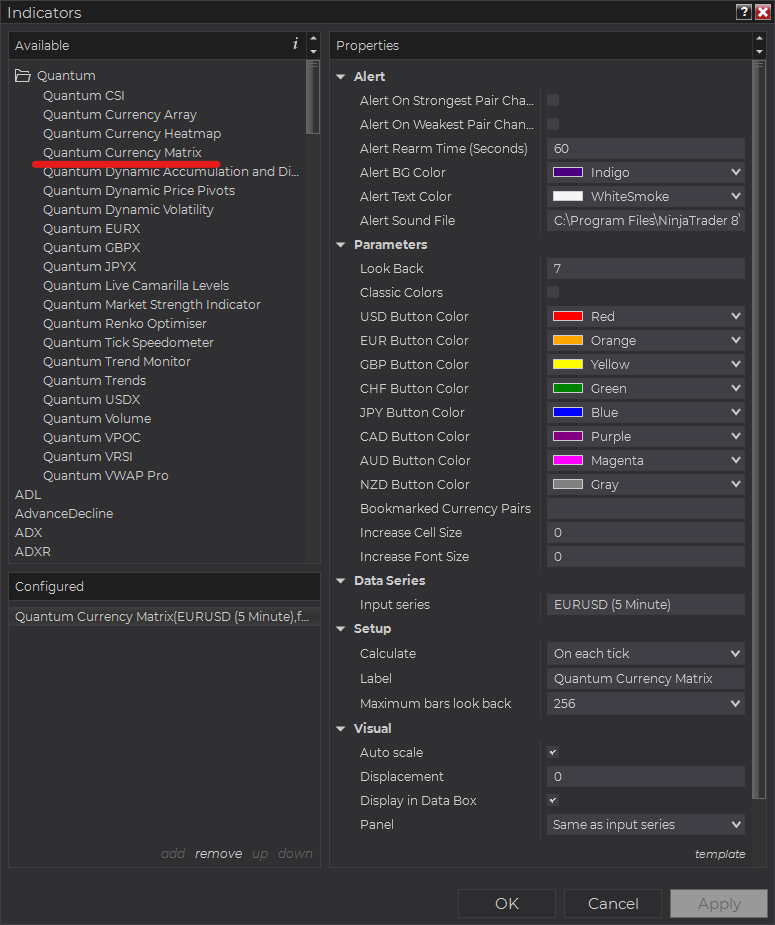
In the Indicators window under Available section, go to Quantum > Quantum Currency Matrix and click it to select the indicator. Once selected, click “add” under the Configured section which will put it on the list of active indicators to be added in the chart.
Before clicking the OK or Apply button to complete, the indicator has several configurable options. You can click the Apply button at any time, and this will apply any changes you have made to the indicator without closing the window. This will allow you to see the changes you have made to the indicator, without closing with the OK button or the Cancel button.
Configuration
All user input can be configured at the right-hand side of the Indicators window under the Properties section. These are the default settings when you add the indicator in a chart.
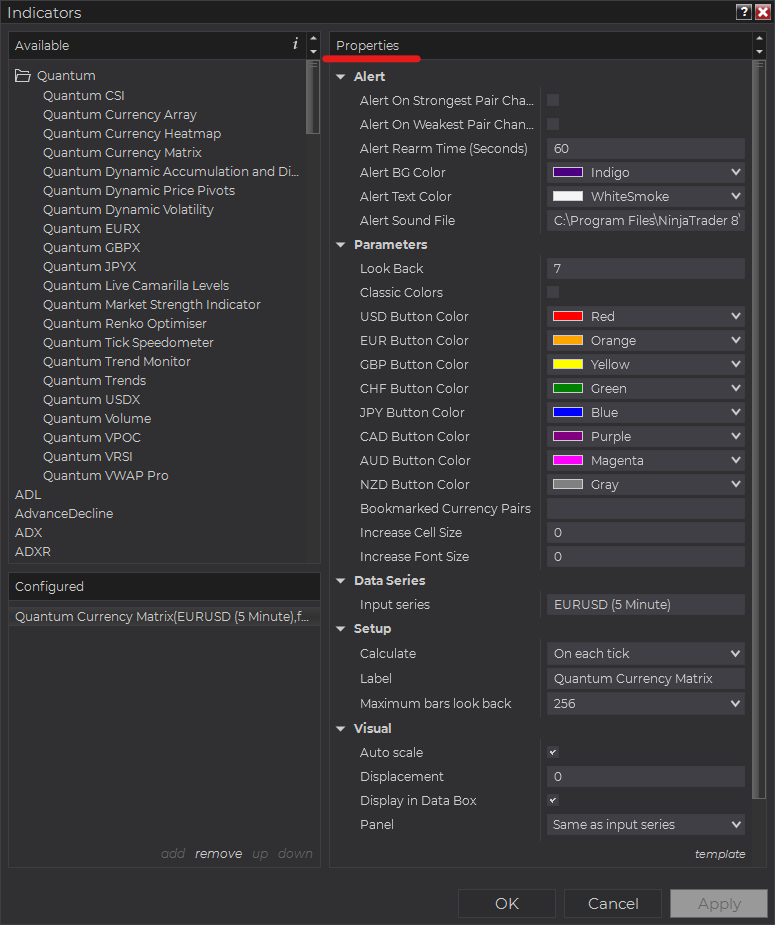
Main Settings
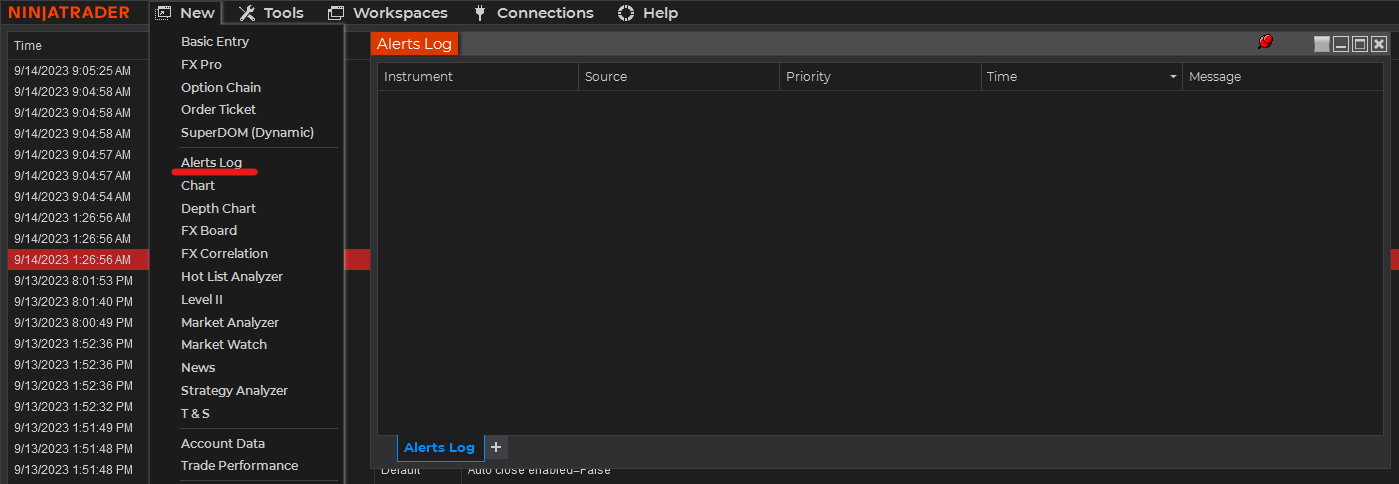
Alert
The following settings affect the indicator’s alert notifications displayed in the Alerts Log. You can open the Alerts Log from your NinjaTrader 8 client’s menu bar in the main window at New > Alerts Log.
Alert On Strongest Pair Change
When enabled, the indicator sends an alert notification in the Alerts Log when the top currency pair in the ranking changes.
Alert On Weakest Pair Change
When enabled, the indicator sends an alert notification in the Alerts Log when the bottom currency pair in the ranking changes.
Alert Rearm Time (Seconds)
This adds a delay to the next alert notification, expressed in number of seconds.
Alert BG Color
This setting allows you to customize the background color of the indicator’s messages as they appear in the Alerts Log.
Alert Text Color
This setting allows you to customize the color of the text as the indicator’s messages appear in the Alerts Log.
Alert Sound File
You can change here the sound file the platform uses when this indicator triggers an alert. By default, it uses the Alert1.wav file packaged with your NinjaTrader installation. Please make sure that the file is supported and the absolute path to the sound file is entered correctly.
Parameters
Look Back
The Currency Matrix calculates the performance of each currency pair within a certain period within the current chart’s timeframe. This setting defines the length of this period which starts from the Look Back bar up to the current bar.
Classic Colors
When enabled, the Currency Matrix switches from green to red gradients to a simpler dual red (bearish) and blue (bullish) color scheme to indicate the current sentiment of each currency pair.
USD Button Color
Sets the color of the USD toggle button.
EUR Button Color
Sets the color of the EUR toggle button.
GBP Button Color
Sets the color of the GBP toggle button.
CHF Button Color
Sets the color of the CHF toggle button.
JPY Button Color
Sets the color of the JPY toggle button.
CAD Button Color
Sets the color of the CAD toggle button.
AUD Button Color
Sets the color of the AUD toggle button.
NZD Button Color
Sets the color of the NZD toggle button.
Bookmarked Currency Pairs
This helps you keep track of currency pairs wherever they are in the Currency Heatmap. To bookmark a currency pair, simply enter its symbol (without any prefix or suffix) in this field like so:
eurusd
You can bookmark multiple currency pairs at the same time by adding a space between them. For example, if you like to bookmark EURUSD, AUDCHF and USDJPY, simply enter the following value in this field:
eurusd audchf usdjpy
All bookmarked currency pairs are given a distinct color so you can see them easily in the constantly changing list. They are also not affected by the currency filters.
Increase Cell Size
Increases the size of the indicator’s grid cells in increments of 1. It can be any value from 0 to 15.
Increase Font Size
Increases the size of the text within the indicator in increments of 1. It can be any value from 0 to 10.
Other Settings
Data Series
Input Series
Opens the indicator Input Series dialogue which allows you to select the source of data for your indicator’s calculations.
Setup
Calculate
Sets the frequency at which the indicator performs its calculations.
Label
The label of the indicator’s instance displayed on the chart.
Maximum bars look back
Determines the maximum number of bars the indicator can look back to perform calculations on historical data. This is set to 256 by default (the most memory-friendly setting), but it can be changed to “infinite” to allow for a greater look back period.
Visual
Auto scale
When enabled, the indicator will be included in the chart panel’s vertical automatic scaling.
Displacement
Sets the number of bars by which to displace the indicator plots.
Display in Data Box
Enables or disables the inclusion of the indicator’s plot values in the Data Box
Panel
Sets the panel in which the indicator is plotted. If you select “Same as input series,” the indicator will be linked to the Input Series and automatically move if the Input Series is modified to a different panel.
Price marker(s)
When enabled, the indicator value is plotted in the axis selected under the “Scale Justification” property.
Scale justification
Sets the scale on which the indicator will be plotted. Possible values are “Right,” “Left,” and “Overlay”.
Visible
Enables or disables visibility and function of the indicator on the chart.
Unloading the indicator
Here are the steps to remove the indicator in the chart.
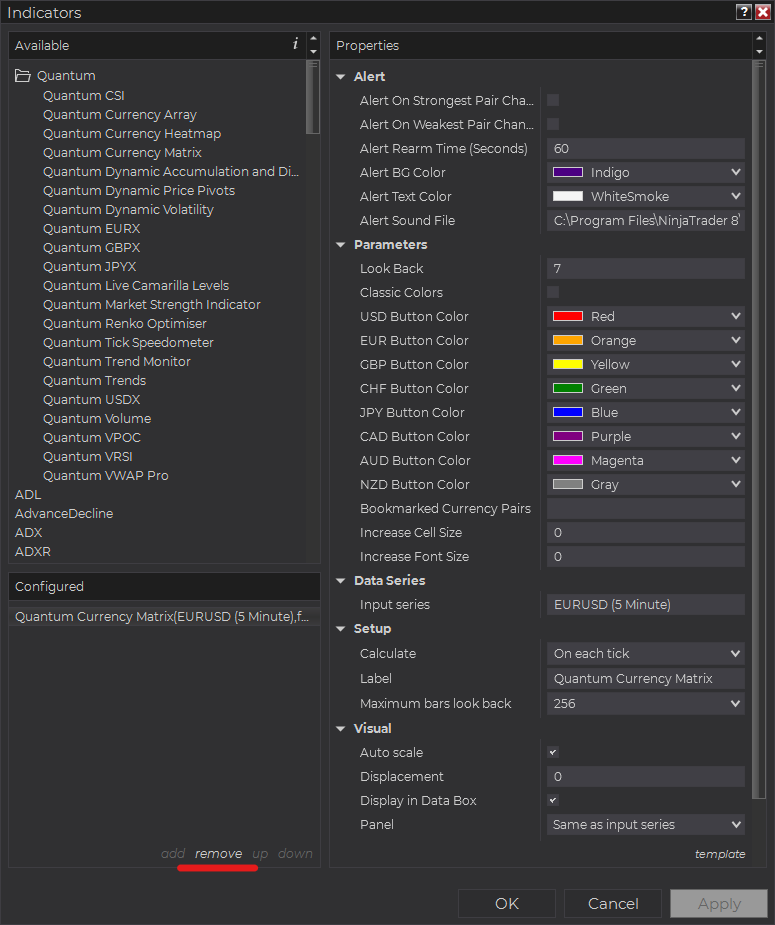
Right-click on the chart then select Indicators… from the menu. Select Quantum Currency Matrix from the Configured section and click OK to confirm and the indicator should be unloaded from your chart.
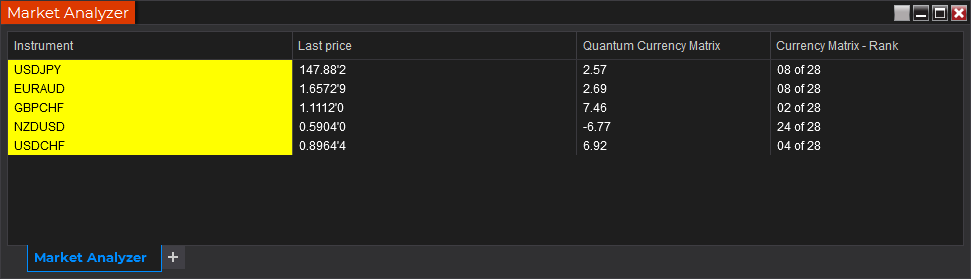
Using the Quantum Currency Matrix in the NinjaTrader Market Analyzer
Valid Rows
The Quantum Currency Matrix focuses on forex and can be used in a specific set of instruments only. The row instrument must be one of the 28 currency pairs from the combinations of the 8 major currencies in the Quantum CSI (USD, EUR, GBP, CHF, JPY, CAD, AUD, NZD).
Adding the Quantum Currency Matrix as a Market Analyzer Column
Here are the basic steps to add the Quantum Currency Matrix in the Market Analyzer:
Make sure valid rows are present in the Market Analyzer window.
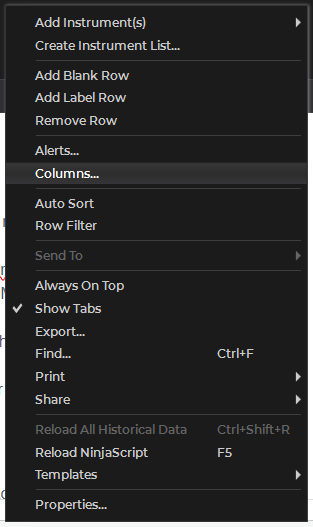
Right-click anywhere in the Market Analyzer window then select “Columns…” in the context menu.
The Columns window appears. In the Available section, go to QuantumMarketAnalyzerColumns folder then double-click the Quantum Currency Matrix to add the indicator as one of the columns in the Market Analyzer.
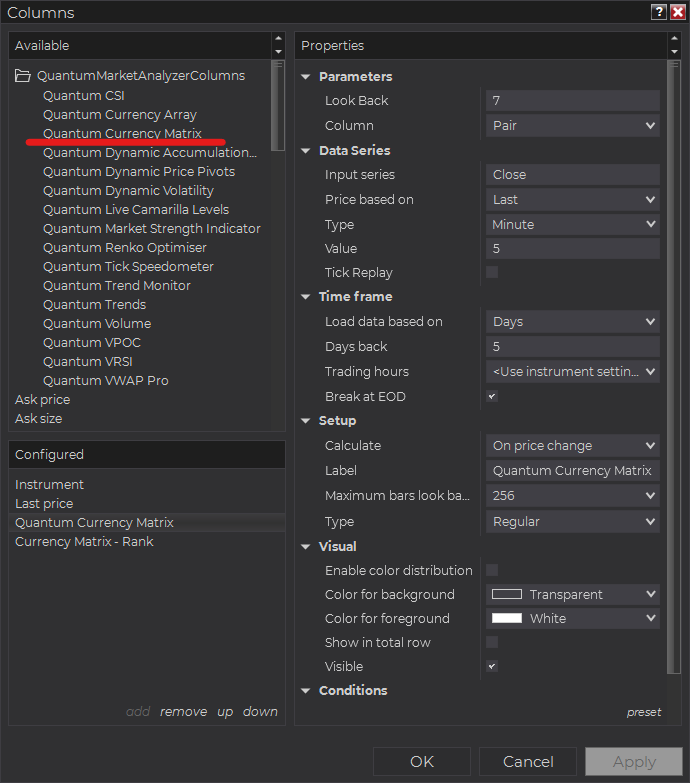
Select the type of information you like to display using the Column drop down menu under the Properties section of the indicator.
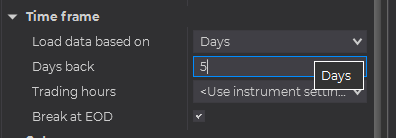
Set the timeframe of the indicator in Properties > Data Series section with the following user inputs:
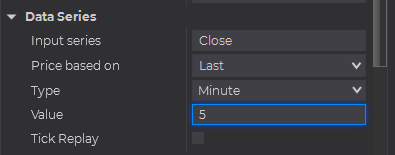
Type – select a time-based series such as Minute or Day
Value – set the interval for the type of series selected above
When running the indicator in timeframes less than Hourly intervals, please configure the “Load data based on” property to “Days” and the “Days back” property to the default value of 5 days to ensure that there is enough data for the indicator to work with.
After you have finished all your configurations, click OK to confirm your chosen settings and to add the indicator as a column in your Market Analyzer window.
Column Options
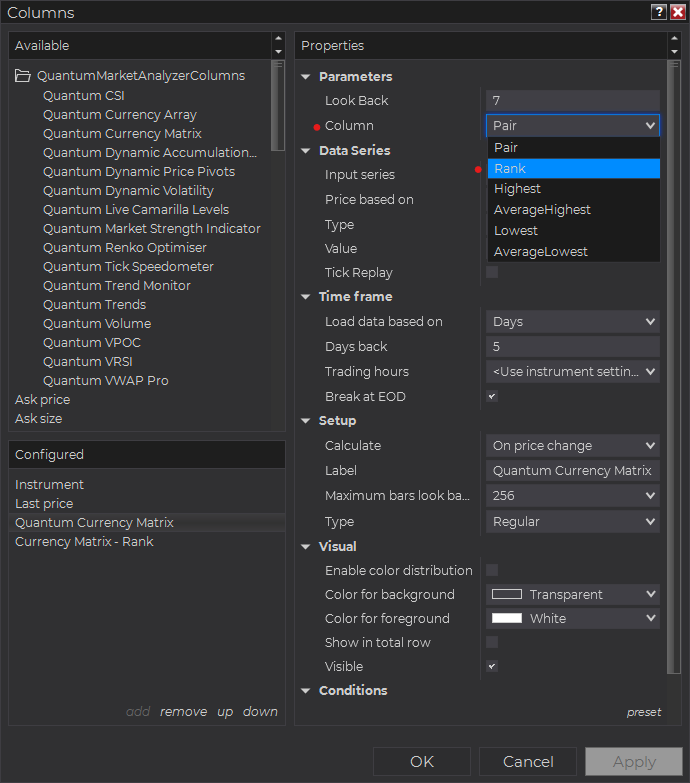
The Quantum Currency Matrix is a multi-faceted indicator that can display different types of signals which can be selected through its Column drop down menu found under the Properties section. You can customize the indicator’s function in the Market Analyzer by selecting any of the enumerated options below.
- Pair – displays the current strength value of the currency pair as calculated by the Currency Matrix.
- Rank – displays the current rank of the currency pair as calculated by the Currency Matrix.
- Highest – displays the current Highest strength value in the Currency Matrix while also displaying the current strength of the currency pair.
- AverageHighest – displays the Average Highest strength value in the Currency Matrix while also displaying the current strength of the currency pair.
- Lowest – displays the current Lowest strength value in the Currency Matrix while also displaying the current strength of the currency pair.
- AverageLowest – displays the Average Lowest strength value in the Currency Matrix while also displaying the current strength of the currency pair.
Tip: You can change the Label property of the column to describe what type of signal you choose to display.


