General – getting started
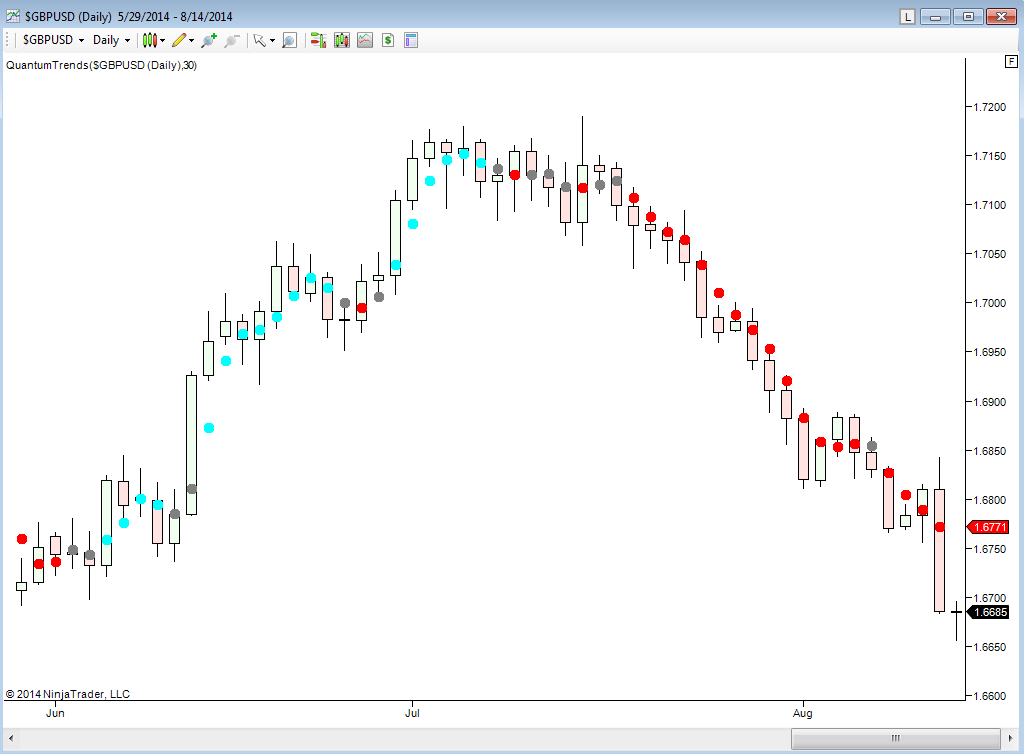
The Quantum Trends indicator for NinjaTrader is a ‘sister’ indicator to the Quantum Trend Monitor, and works together hand in hand, to keep you in and surfing the trend. This indicator has been designed as a leading indicator of trend and is therefore extremely sensitive to the minor reversals and pullbacks that occur in all trends. This is where the TrendMonitor becomes so powerful, keeping you in for the long term. The Trends indicator has also been designed to show you, simply and clearly, when a trend is potentially starting, ending, or moving into a minor congestion phase. All this is achieved with the trend dots, which change color accordingly.
As with all the Quantum trading indicators for NinjaTrader, the Quantum Trends is best used in multiple timeframes, which will then give you visual signals to changes in trend, both upstream and downstream of your principal trading chart.
- The Quantum Trends indicator for NinjaTrader works in all timeframes from tick and seconds to minutes and months
- The indicator can be ‘fine-tuned’ to your own preferences in terms of the speed with which the indicator will react to possible changes in trend
Installation
Open your NinjaTrader platform and select a chart
- Right click – this will open the following window:
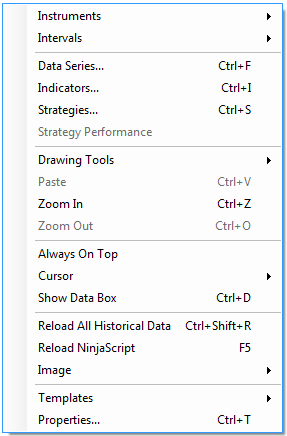
- Left click > Indicators
This will open the following window: (you can also open this window in another way by clicking on the Indicators icon in the NinjaTrader toolbar)
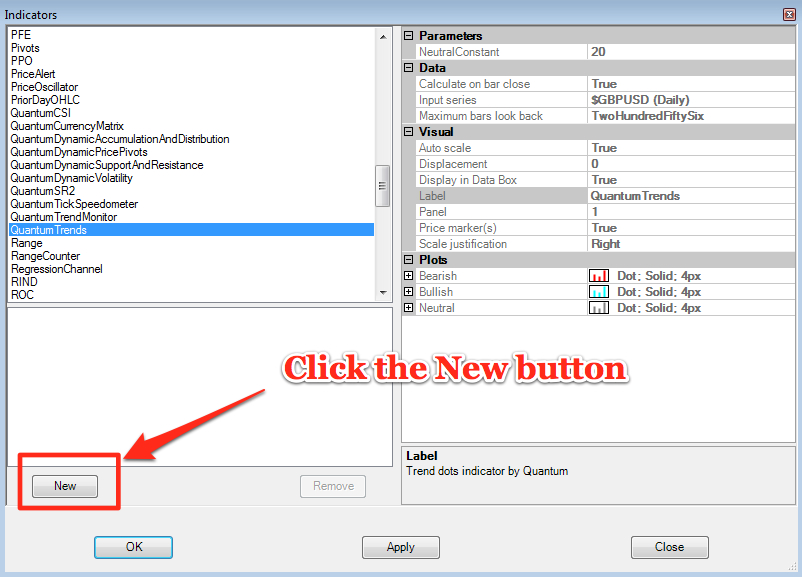
Scroll down to the QuantumTrends indicator:
- Left click > This will highlight the indicator in blue
- Left click > ‘New’ button as shown above
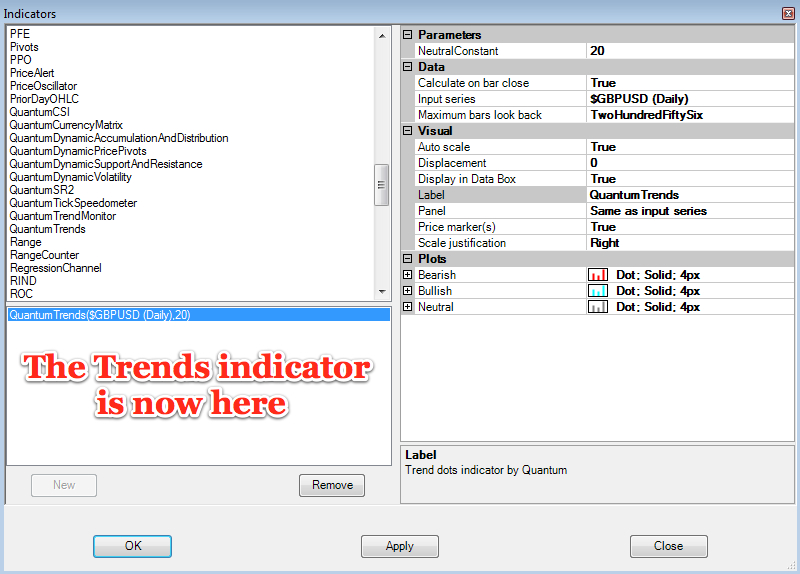
This will add the QuantumTrends indicator in the box below as shown here:
Before clicking the OK or Apply button to complete, the indicator has one or two options which can be configured. You can click the Apply button at any time, and this will apply any changes you have made to the indicator, without closing the window. This will allow you to see the changes you have made, and to modify again before closing with the OK button, or the Close button. All of the user configuration is done on the right hand side of the above screen, which is shown enlarged below. These are the default settings when you first install the indicator to a chart.
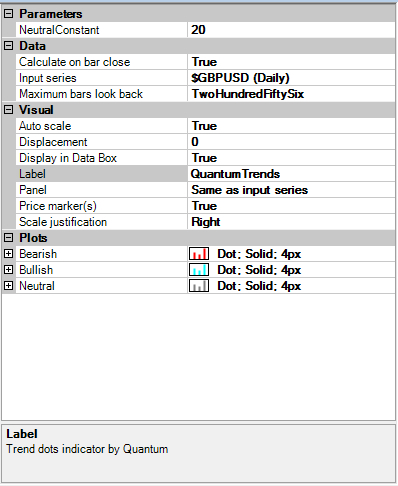
Parameters
These are the Parameters inputs:
NeutralConstant – this parameter gives you full control over the sensitivity of the Trends indicator, by allowing you to fine tune the indicator to your own trading style and preferences. Increasing this parameter makes the indicator more sensitive to determining weak trends hence the transitional trend dots will expand, while reducing the value will also reduce these regions making transitions appear more quickly. This is a personal choice and as always in trading it is a question of assessing risk – the risk of getting in too early or too late, and also the risk of getting out too early or staying in too long. From our experience we have found that a value of 20 is a good starting point, and this value can then be adjusted to suit your trading style accordingly. Any number above 20 will increase the periods of congestions when the grey trend dots will be more numerous, whilst any number below 20 will reduce them accordingly. To change the setting:
- Place your mouse on the NeutralConstant label, and left click. This will highlight NeutralConstant in blue. Left click in the value field alongside and your cursor will appear. Delete the default number using the back button and enter a new number, such as 25 to increase or 15 to decrease
Data
These are the Data inputs:
Calculate on bar close – please DO NOT change this setting and leave as the default of True
Input series – this shows the timeframe for the indicator and will be displayed according to the chart time. In this case the indicator was attached to a daily chart for the GBP/USD spot market
Maximum bars look back – this is the maximum number of bars in the look back for the indicator. We suggest you leave this as the default of TwoHundredFiftySix as it is memory friendly
Visual
These are the Visual inputs:
Auto Scale – DO NOT change this setting and leave this as the default of True
Displacement – DO NOT change this setting and leave this at the default of 0
Display in Data Box – we suggest you leave this at the default of True
Label – this is the label which will display on the chart once the indicator is attached. You can remove this if you wish as follows:
- Place your mouse on the Label label, and left click. This will highlight Label in blue. Left click in the value field alongside and your cursor will appear. Delete the text using the back button and when you apply the indicator, the text will no longer be displayed
Panel – this specifies the panel number where the indicator will appear. We suggest you leave this as the default of Same as input series
Price Marker(s) – please DO NOT alter this setting and leave as the default of True
Scale Justification – please DO NOT alter this setting and leave as the default of Right
Plots
This is where you can change the color and style of the Quantum Trends indicator. There are three trend dots displayed by the indicator, bearish, bullish and finally neutral when the market is in a congestion phase of price action. Each of these is changed in the same way, and we have therefore only shown one example here using the Bearish settings.
Bearish – to access the settings, left click on the Bearish label which will then turn blue. Left click on the + icon and the following options will then be displayed:
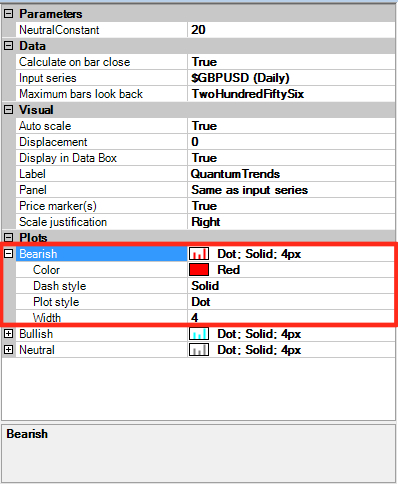
Color – to change the color left click on the Color label which will turn blue. A drop down arrow will appear in the value field. Left click the drop down arrow and the color options will then be displayed. Use the scroller on the right to select your preferred color which will then appear in the value field alongside.
Dash style -to change the style of the indicator, left click on the Dash style label which will turn blue. A drop down arrow will appear in the value field. Left click the drop down arrow and the plot style options will then be displayed. Select your preferred style from the drop down menu which will then appear in the value field alongside
Plot style – to change the style of the indicator, left click on the Plot style label which will turn blue. A drop down arrow will appear in the value field. Left click the drop down arrow and the plot style options will then be displayed. Select your preferred style from the drop down menu which will then appear in the value field alongside
Width – to change the width of the Trends indicator, left click on the Width label which will turn blue. Left click the value field alongside and use the back space key to delete the existing value, and replace with a new value. The default is 4px, and any number higher than this will then increase the width, whilst a lower number will decrease the width. You do not need to enter ‘px’ after the number. Simply enter a whole number to change the width of the dot or symbol to your preferred appearance Once you have made all the changes to the settings for the QuantumTrends indicator left click the OK button to complete and update the indicator.
Removing an indicator
These are the steps to remove a NinjaTrader indicator from a chart: Right click on the chart and then left click on Indicators from the pop up menu. Scroll down to the indicator you wish to remove and left click which will turn the indicator blue. This will then display the indicator window with its settings as shown below:
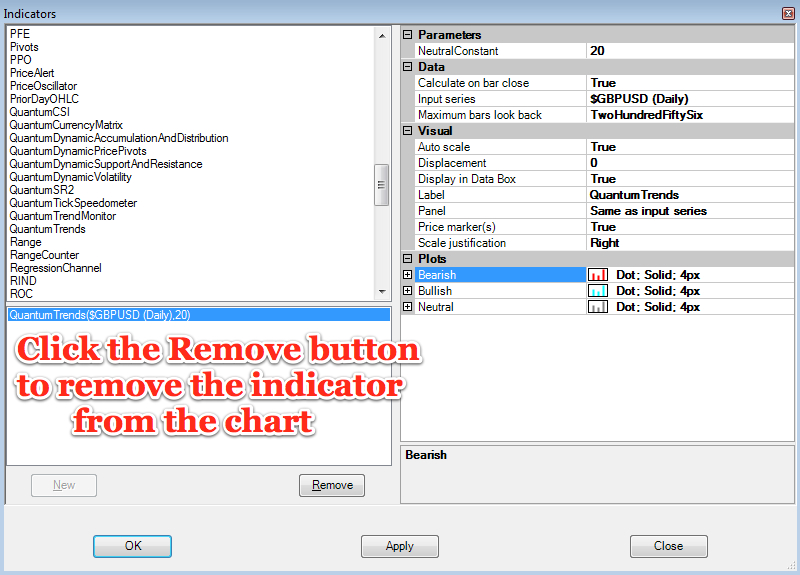
Simply left click on the Remove button as shown above, and the indicator will disappear from the list of indicators on the chart. To confirm left click the OK button to confirm and close the window.


