Introduction
Renko charts are one of the most popular Japanese charting techniques and there are several reasons for this.
First it allows traders to focus solely on price as the chart filters out all minor price fluctuations and market ‘noise’. This makes it easier for traders not only to identify strong moves, but also to spot significant turning points, and so allow traders to deploy smarter entries and exits.
Second, a renko chart then helps traders in what is probably one of the most difficult aspects of trading, namely staying in a position once a move is underway. The renko chart does this by displaying price momentum as it speeds up and slows down. And it does this because a renko chart is devoid of time.
And by ignoring time renko charts focus solely on price moves that meet a pre-determined value, with the chart displaying price ‘bricks’ that represent this fixed price move. The bricks are drawn at 45-degree angles from each and are usually based on the closing price for the input value. So, for example if a brick is set to close once 10 pips, points or cents have gone through the market it will only do so once this value has completed.
However, there is one major disadvantage to a standard renko chart and that is traders must manually input a value to the renko chart, and whilst experienced traders can develop a ‘feel’ for the optimum value, this can take time to develop.
After all, how do you choose the “right” value? Indeed, what is the reasoning behind choosing a brick size, and is there a systematic way to pick a brick size for any situation?
And for traders who are new to the concept of Renko charts, it can be daunting and often is simply a ‘guess’ at what might be considered a ‘reasonable’ number of pips, points, or cents.
And this is where the Quantum Trading Renko Optimizer indicator for NinjaTrader steps in, as it has been developed to offer traders all the advantages of using a renko chart with the added benefit the trader no longer has to worry about guessing the optimal setting for any instrument or market. The indicator delivers the optimal setting automatically.
So how does it work?
The Quantum Trading Renko Optimiser indicator for NinjaTrader offers a simple, effective, and systematic method in choosing the most effective brick size, and the best part of all – it’s all done with just the click of a button!
By using Average True Range the Renko Optimiser indicator starts by calculating the degree of volatility of the instrument within a given period and timeframe. You may already be familiar with ATR and by using the ATR to determine the brick size, we can eliminate the noise or volatility normally present in a candlestick chart. It is a popular technique used by traders with Renko charts but which is all automated by the Renko Optimiser indicator.
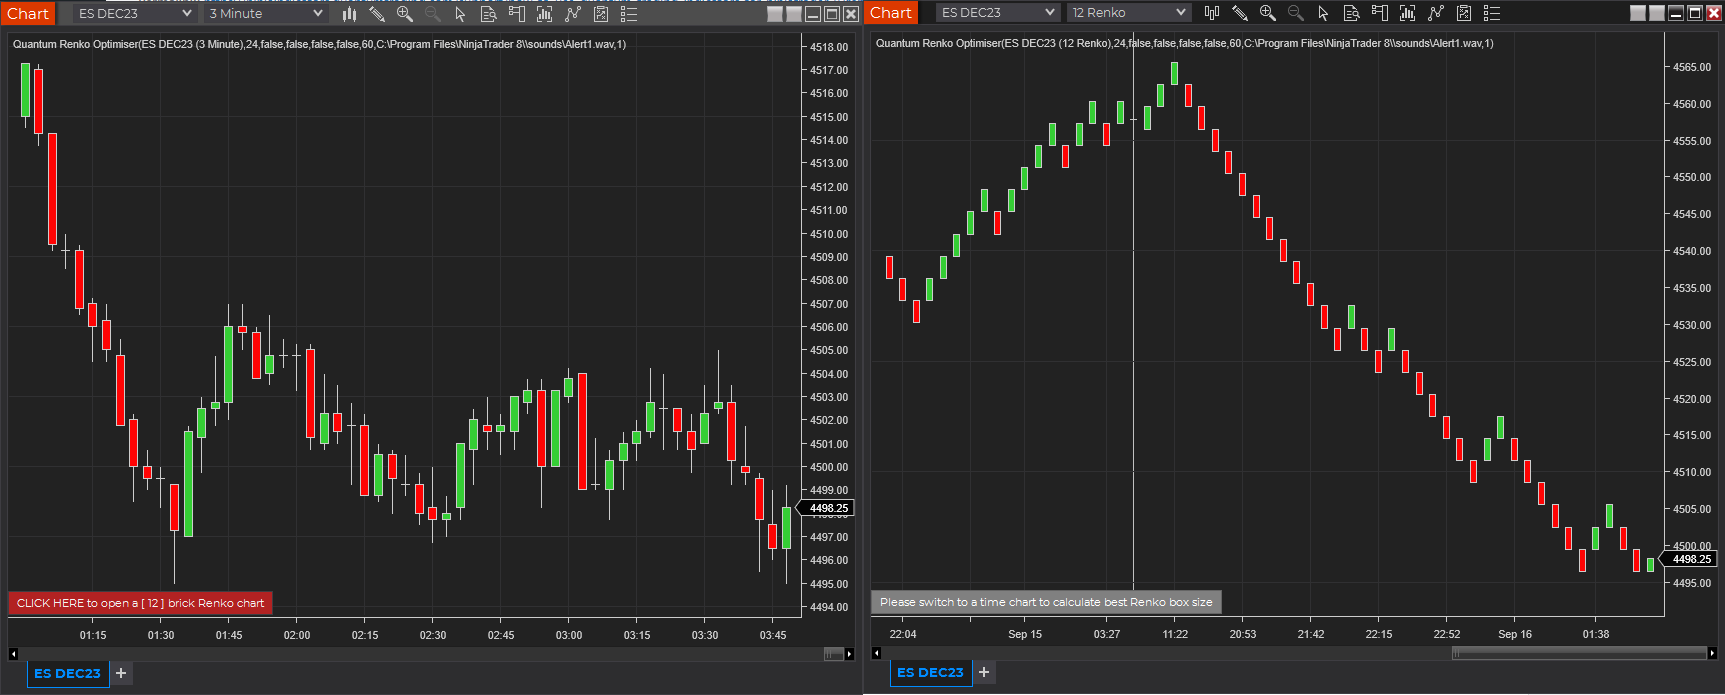
Everything is then encapsulated in a button conveniently located at the bottom of the chart. This button displays the calculated best brick size for the current market and timeframe selected. By clicking the button, the indicator automatically reconfigures the current candlestick chart to switch to an optimized NinjaTrader Renko chart using the calculated brick size.
The Renko Optimiser indicator has been streamlined to bring you an intuitive trading experience when working with Renko charts in the NinjaTrader platform. You can start using it in 2 easy steps:
Step 1: Open a time chart of the instrument of your choice and apply the Quantum Renko Optimiser. (Make sure that its Data Series is time-based. Example: 3 Minute)
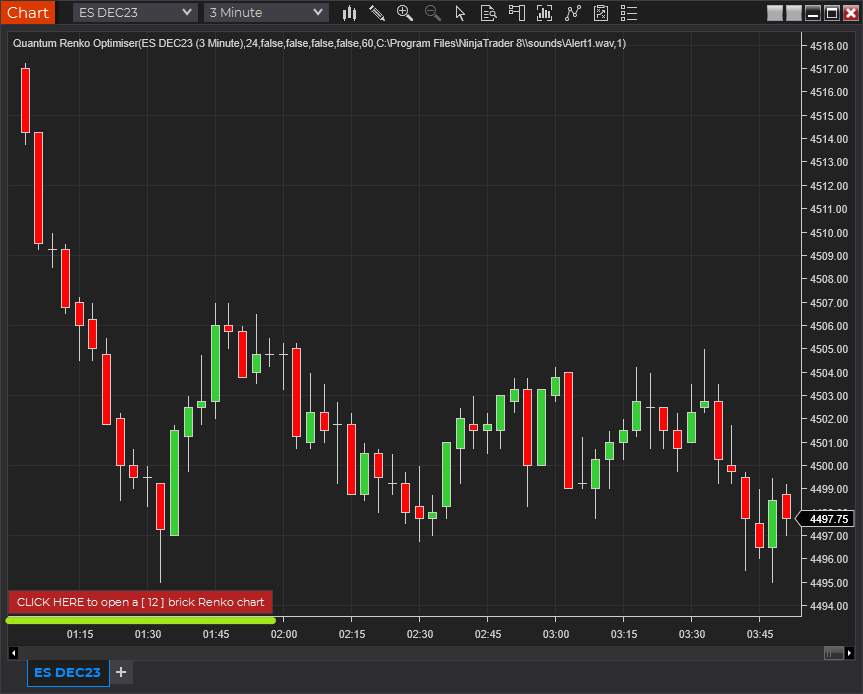
Step 2: When applied, the indicator calculates the best box size in the context of the current timeframe and displays it in a button located at the bottom of the chart. Simply click this button to switch the chart to Renko with the current calculated best box size.
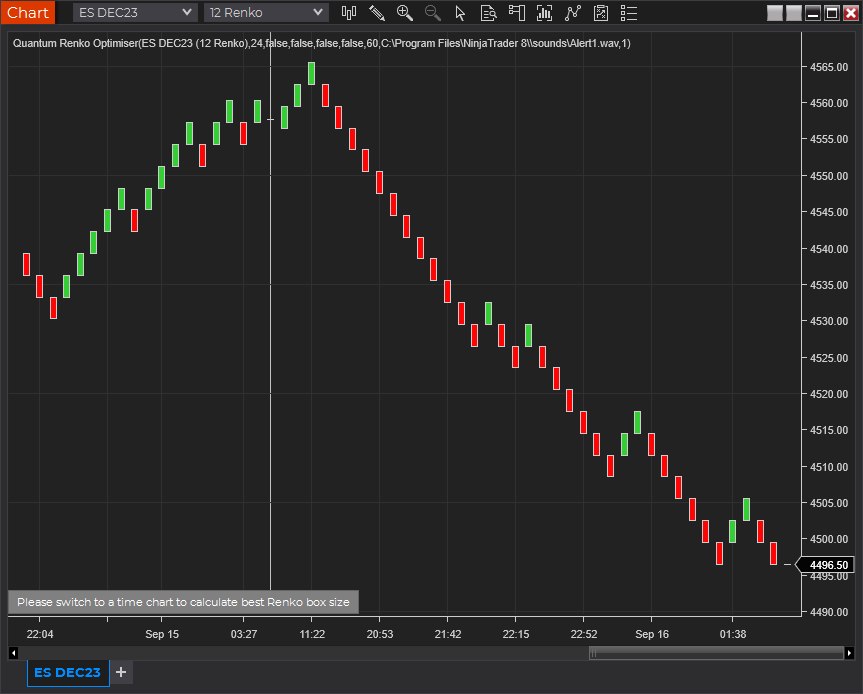
Please note that the button is disabled while the chart is in Renko mode. You can reactivate it by switching the chart back to a time-based Data Series.
Installation
Open your NinjaTrader 8 platform and select a chart.
Right click the chart to bring up a menu which looks like the following image:
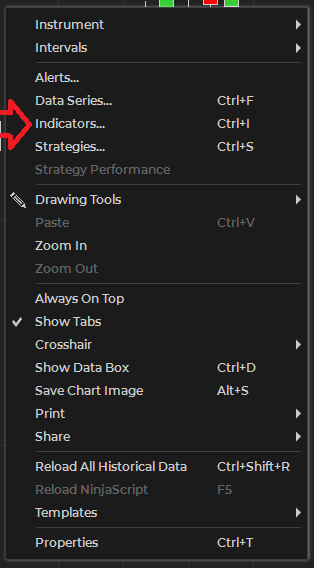
Select Indicators… which will open the following window. Alternatively, you can open this window by clicking the Indicators button in the chart toolbar or by pressing Ctrl + I while focused on the chart.
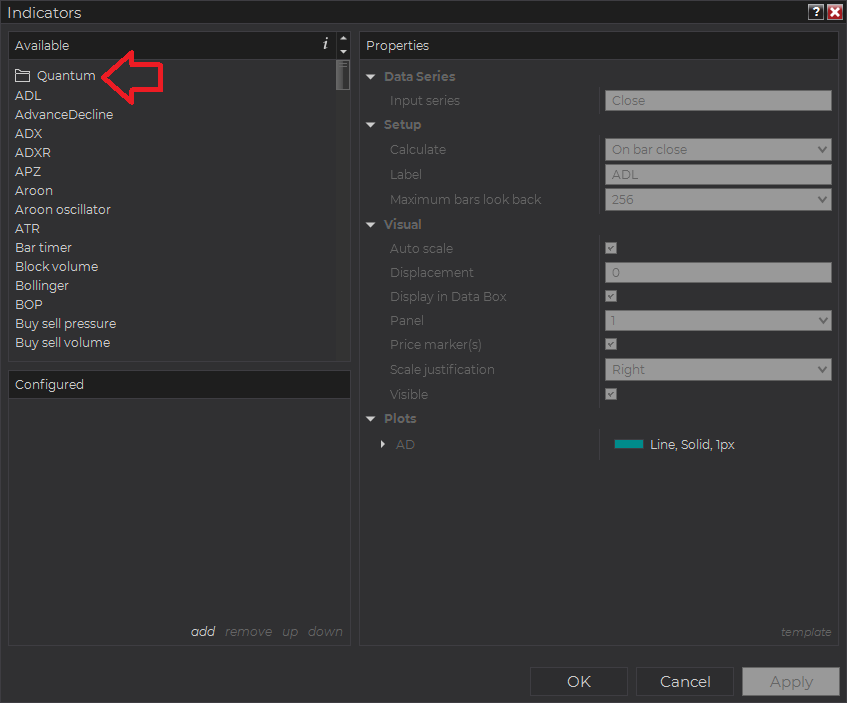
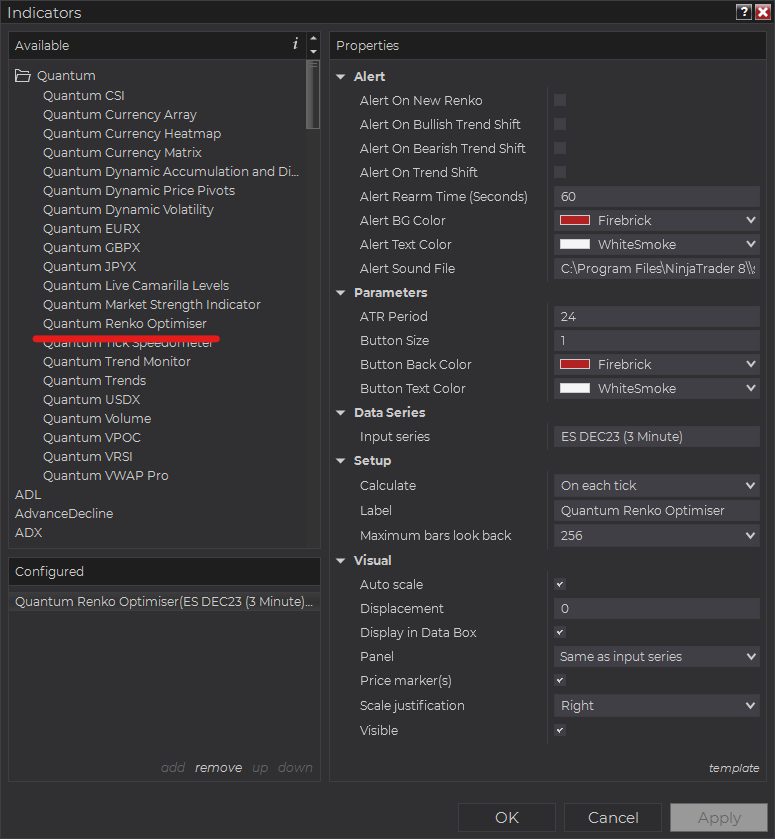
In the Indicators window under Available section, go to Quantum > Quantum Renko Optimiser and click it to select the indicator. Once selected, click “add” under the Configured section which will put it on the list of active indicators to be added in the chart.
Before clicking the OK or Apply button to complete, the indicator has several configurable options. You can click the Apply button at any time, and this will apply any changes you have made to the indicator without closing the window. This will allow you to see the changes you have made to the indicator, without closing with the OK button or the Cancel button.
Configuration
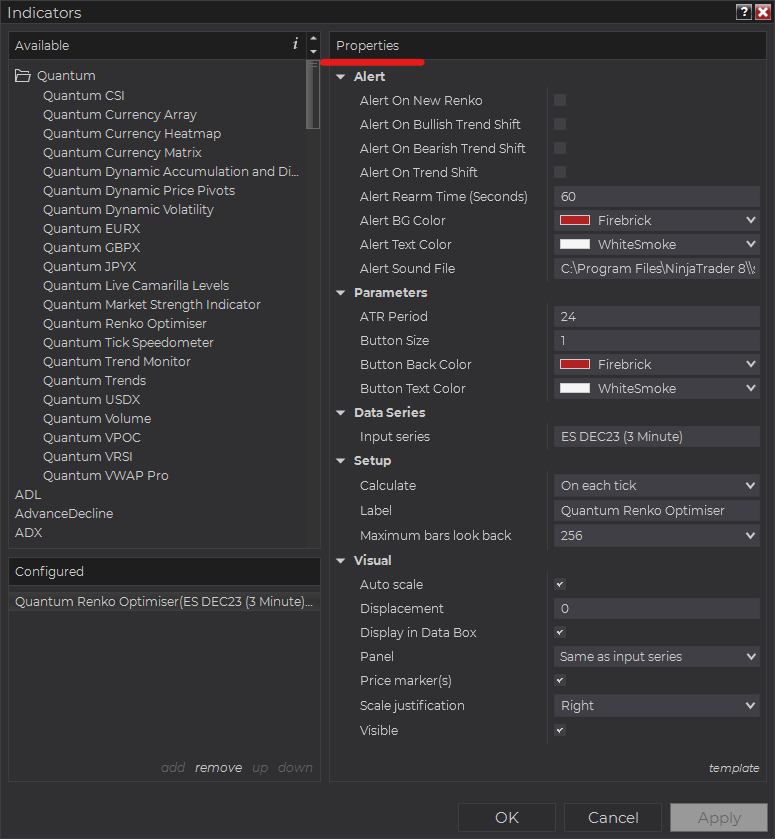
All user input can be configured at the right-hand side of the Indicators window under the Properties section. These are the default settings when you add the indicator in a chart.
Main Settings
Alert
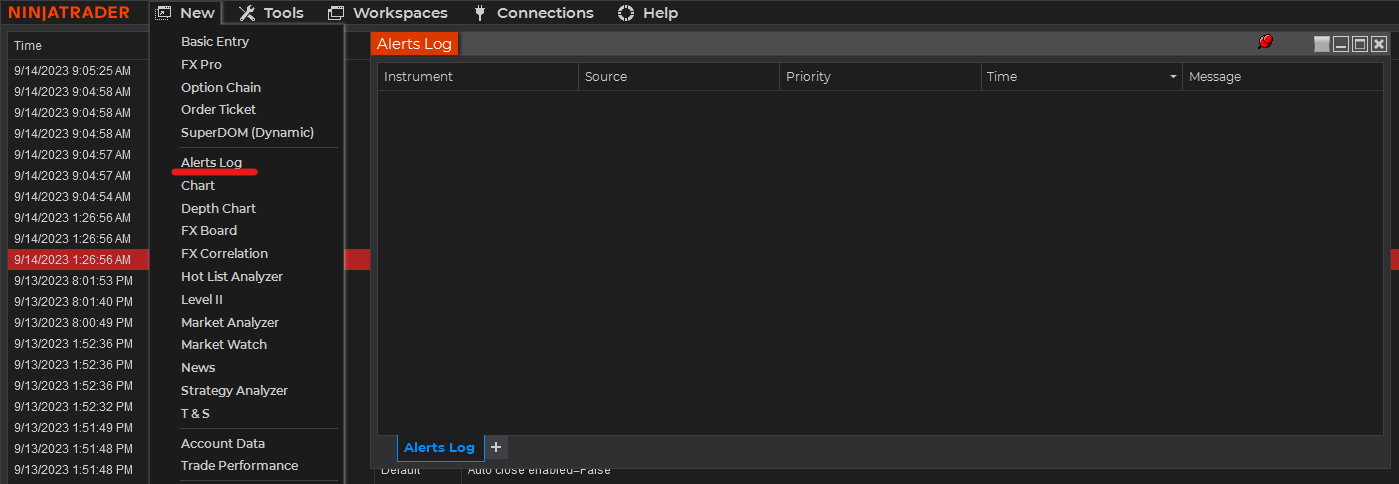
The following settings affect the indicator’s alert notifications displayed in the Alerts Log. You can open the Alerts Log from your NinjaTrader 8 client’s menu bar in the main window at New > Alerts Log.
Alert On New Renko
When enabled, the indicator sends an alert notification in the Alerts Log when a new Renko brick is created while the current chart type is Renko.
Alert On Bullish Trend Shift
When enabled, the indicator sends an alert notification in the Alerts Log when trend changes to a bullish direction while the current chart type is Renko.
Alert On Bearish Trend Shift
When enabled, the indicator sends an alert notification in the Alerts Log when the trend changes to a bearish direction while the current chart type is Renko.
Alert On Trend Shift
When enabled, the indicator sends an alert notification in the Alerts Log when the current trend changes to an opposite direction while the current chart type is Renko.
Alert Rearm Time (Seconds)
This adds a delay to the next alert notification, expressed in number of seconds.
Alert BG Color
This setting allows you to customize the background color of the indicator’s messages as they appear in the Alerts Log.
Alert Text Color
This setting allows you to customize the color of the text as the indicator’s messages appear in the Alerts Log.
Alert Sound File
You can change here the sound file the platform uses when this indicator triggers an alert. By default, it uses the Alert1.wav file packaged with your NinjaTrader installation. Please make sure that the file is supported and the absolute path to the sound file is entered correctly.
Parameters
ATR Period
Sets the period of the ATR function in the indicator that helps calculate the optimised Renko box size.
Button Size
Increasing the value of this setting enlarges the Renko calculating button that the indicator creates on the chart.
Button Back Color
Sets the background color of the Renko calculating button.
Button Text Color
Sets the font color of the Renko calculating button.
Other Settings
Data Series
Input Series
Opens the indicator Input Series dialogue which allows you to select the source of data for your indicator’s calculations.
Setup
Calculate
Sets the frequency at which the indicator performs its calculations.
Label
The label of the indicator’s instance displayed on the chart.
Maximum bars look back
Determines the maximum number of bars the indicator can look back to perform calculations on historical data. This is set to 256 by default (the most memory-friendly setting), but it can be changed to “infinite” to allow for a greater look back period.
Visual
Auto scale
When enabled, the indicator will be included in the chart panel’s vertical automatic scaling.
Displacement
Sets the number of bars by which to displace the indicator plots.
Display in Data Box
Enables or disables the inclusion of the indicator’s plot values in the Data Box
Panel
Sets the panel in which the indicator is plotted. If you select “Same as input series,” the indicator will be linked to the Input Series and automatically move if the Input Series is modified to a different panel.
Price marker(s)
When enabled, the indicator value is plotted in the axis selected under the “Scale Justification” property.
Scale justification
Sets the scale on which the indicator will be plotted. Possible values are “Right,” “Left,” and “Overlay”.
Visible
Enables or disables visibility and function of the indicator on the chart.
Unloading the indicator
Here are the steps to remove the indicator in the chart.
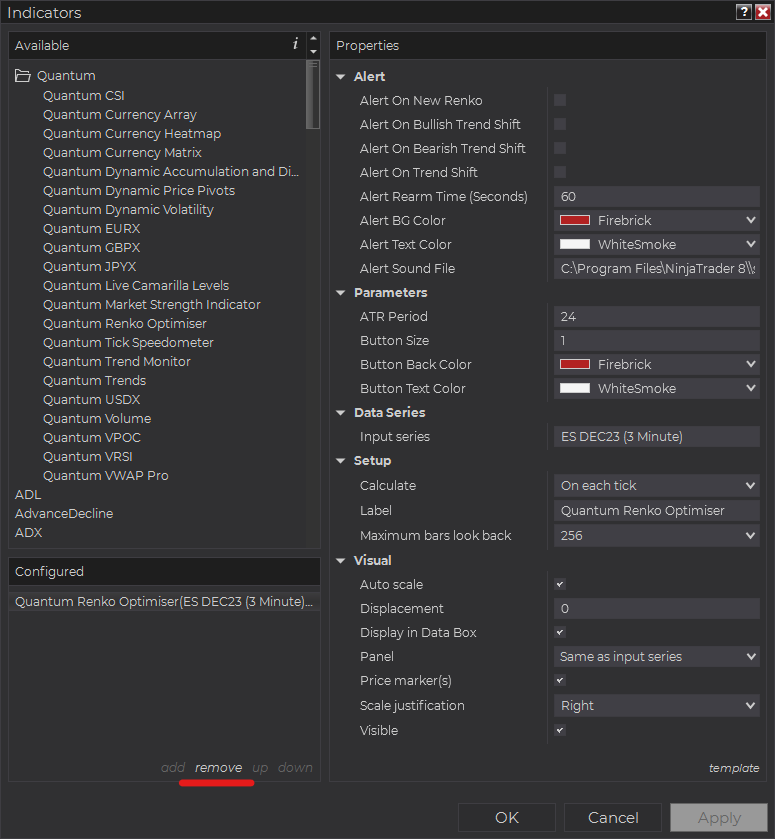
Right-click on the chart then select Indicators… from the menu. Select Quantum Renko Optimiser from the Configured section and click “remove” then OK to confirm and the indicator should be unloaded from your chart.
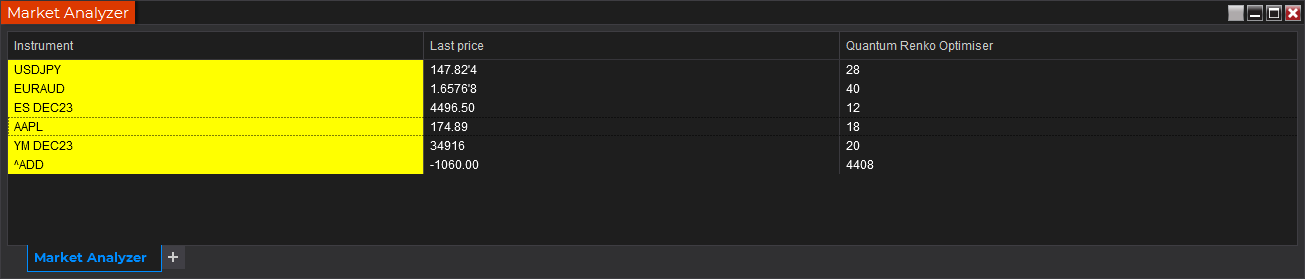
Using the Quantum Renko Optimiser in the NinjaTrader Market Analyzer
Valid Rows
The Quantum Renko Optimiser indicator works in any instrument.
Adding the Quantum Renko Optimiser as a Market Analyzer Column
Here are the basic steps to add the Quantum Renko Optimiser in the Market Analyzer:
Make sure valid rows are present in the Market Analyzer window.
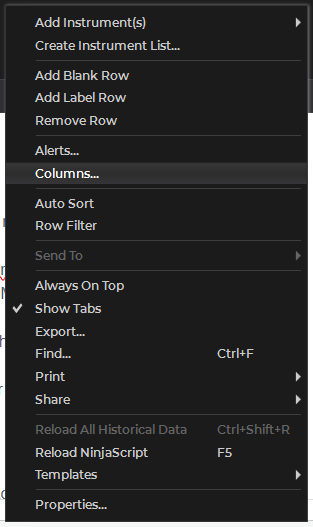
Right-click anywhere in the Market Analyzer window then select “Columns…” in the context menu.
The Columns window appears. In the Available section, go to QuantumMarketAnalyzerColumns folder then double-click the Quantum Renko Optimiser to add the indicator as one of the columns in the Market Analyzer.
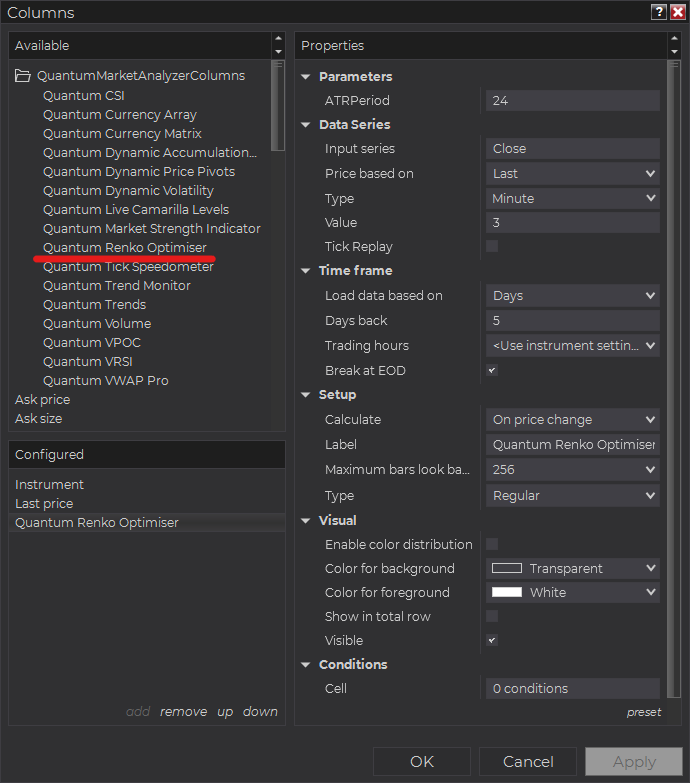
Set the timeframe of the indicator in Properties > Data Series section with the following user inputs:
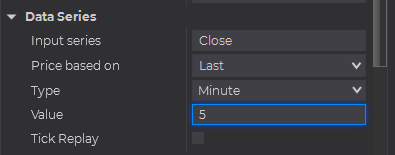
Type – select a time-based series such as Minute or Day
Value – set the interval for the type of series selected above
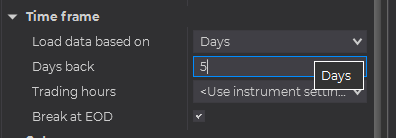
When running the indicator in timeframes less than Hourly intervals, please configure the “Load data based on” property to “Days” and the “Days back” property to the default value of 5 days to ensure that there is enough data for the indicator to work with.
After you have finished all your configurations, click OK to confirm your chosen settings and to add the indicator as a column in your Market Analyzer window.
Column Options
The Quantum Renko Optimiser in the Market Analyzer displays only 1 type of signal, so it does not have a Column property.
- Renko – displays the current optimized Renko box size as calculated by the indicator.
Tip: You can change the Label property of the column to describe what type of signal you choose to display.


