Introduction
The words powerful, unique, and “game-changing ” are often overused when applied to trading indicators, but for the Quantum Live Camarilla indicator NinjaTrader 8, they truly describe it. It is unique because it offers 6 levels, not 4 as well as signals.
Why? Because the indicator offers something for every trader, from the systematic to the discretionary, and from swing trading to breakout trading. And it’s not an indicator which is simply used for entries. The Camarilla indicator delivers in all areas, from getting in to getting out, as well as stop-loss placement. All in one single indicator, which perhaps explains its unique appeal and power to those traders in the know. Now, it’s all here just waiting for you to discover the power of the Camarilla protocol and apply this unique indicator to your own trading and investing tactics.
So, what is the Camarilla protocol, how does it work, and what will it do for me? These are all good questions, so let’s get straight down to basics and explain how the indicator works and how you may wish to use it.
Let’s start with the last of these questions first, as this is one of the unique aspects to this indicator. Put simply, it is a chameleon of an indicator and will appeal whether you are a more discretionary type of trader, making and taking decisions yourself, or if you prefer a more systematic or mechanical approach, often associated with a trading robot, for example. With the Camarilla levels indicator both approaches can be embraced and accommodated.
The Camarilla protocol has its roots in open-outcry trading pits, where traders considered floor pivots an essential tool. Based on these original ideas and incorporating the Camarilla equation we have developed a unique indicator which delivers clear and precise price-based support and resistance levels, which act as targets for profits, triggers for potential reversals, signals for possible breakouts, and finally stop loss placement. So, if you’re a swing or reversal trader, it’s the perfect indicator. Equally if you prefer breakout trading, again it’s the perfect indicator. And all with predetermined and clear levels for any price objectives and profit targets, with stop loss placement covered also.
In other words, a complete indicator delivered with potential trading setups built in to help you see when key levels are being approached or breached.
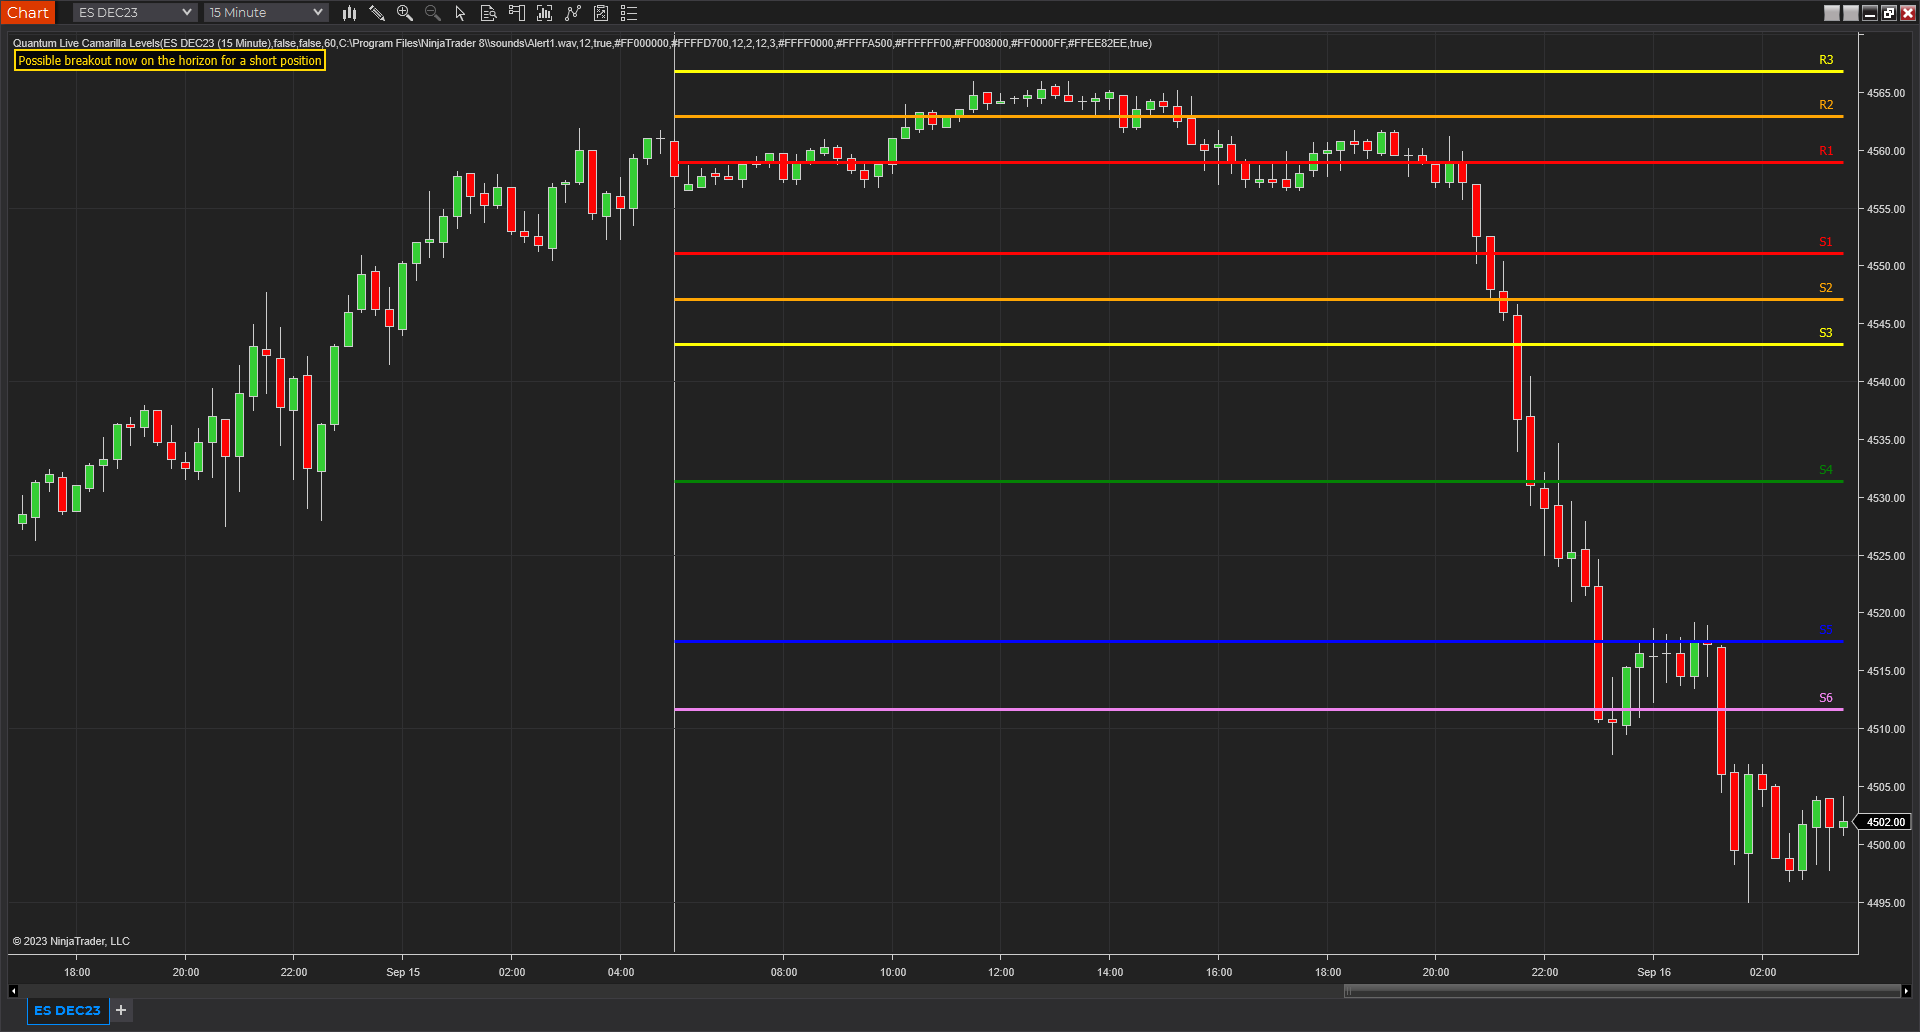
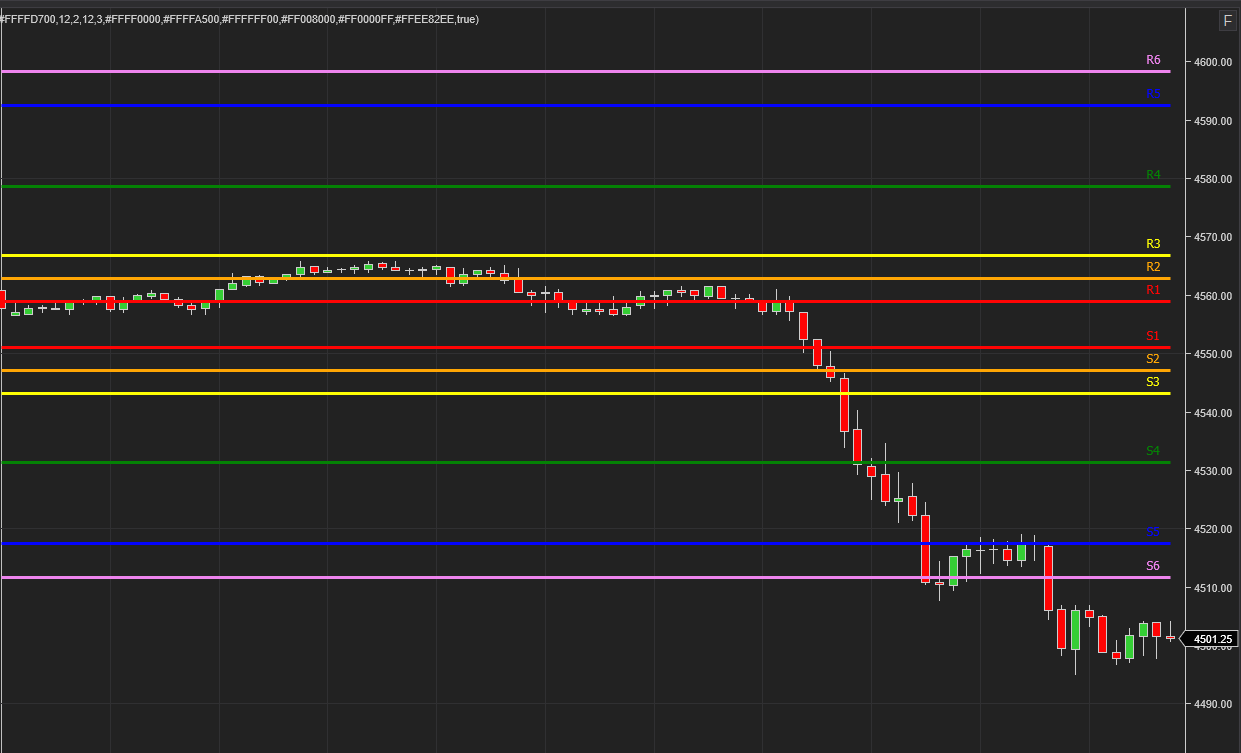
The indicator works in a complex way, but the data is presented simply as six levels above and six levels below the price action. Those above are labelled R1 to R6 and those below S1 to S6, with the region between R1 and S1 which we describe as the ‘buffer zone’. These levels are calculated for the different timeframes in different ways.
For daily timeframes and above the levels remain the same for the month, and they are then recalculated at the start of the new month. For intraday timeframes these are recalculated at the start of each new daily session.
Reversal Trading
For reversal trading the key levels to watch are S3 and R3. These are levels which when approached signal potential reversals. So when price is approaching and tests the S3 level below the buffer zone, a reversal to the upside may be on the horizon. In other words, a reversal from a bearish trend to a bullish trend in that timeframe. Equally, when price is approaching and testing the R3 level above the buffer zone, then a reversal is possible with the bullish price action reversing to bearish. In both cases the next level then denotes the level for the stop loss. For a reversal off the S3 level higher, the stop loss could be placed at S4 and for a reversal off the R3 level, the stop loss could be placed at the R4 level – assuming these levels fit your risk and money management rules.
The potential price targets are then as follows:
- For an R3 reversal the profit targets are from S1 to S3.
- For an S3 reversal the profit targets are from R1 to R3.
Breakout Trading
For breakout trading the key levels are the R4 above the buffer zone and the S4 below. These are levels at which the price is expected to breakout from the current region and develop a strong move away from the region. So, any move to test and break the R4 level is likely to see price continue higher and develop a strong trend. Equally if the S4 level is tested, then price is likely to continue lower and develop a strong trend.
- For an S4 breakout the profit targets are S5 to S6
- For an R4 breakout the profit targets are R5 to R6
Using the Camarilla levels in this way offers a complete solution to two distinct approaches to trading, and in addition, also provide potential target levels along with suggested stop loss positions, but as always these must meet your risk and money management rules.
And it is important to understand the indicator and associated levels can be adopted in two very distinct ways.
First, if you are more suited to mechanical trading where you feel more comfortable with a rule set, then the levels can be considered as your rule set. However, if you are more suited to discretionary trading then the indicator is a perfect complement to other Quantum indicators such as the support and resistance indicator, which again is one based purely on price, and so helps to reinforce levels delivered by the Camarilla protocol. Other indicators such as the Trend Monitor also work perfectly in association with this indicator.
The Camarilla levels indicator works in all timeframes on both standard and custom charts, and in every market, so can be used to trade stocks, commodities, forex, or indices on the NinjaTrader 8 platform.
So whether you’re a discretionary trader who prefers swing trading, or a breakout trader who is more systematic, the Camarilla levels indicator can deliver it all.
To help you when using the indicator, we have also included some simple messages to guide you as the various levels are approached and tested. These appear as follows:
- If the current open price is between R3 and S3 the indicator displays the words – Possible mean reversal trade is on the horizon
- If the current open price is between S3 and S2 the indicator displays the words – Possible long position now on the horizon
- If the current open price is between R3 and R2 the indicator displays the words – Possible short position now on the horizon
- If the current open price is between R3 and R4 the indicator displays the words – Possible breakout now on the horizon for a long position
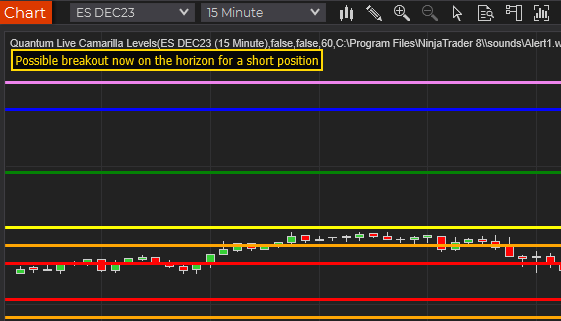
- If the current open price is between S3 and S4 the indicator displays the words – Possible breakout now on the horizon for a short position
- When there is nothing of interest, the indicator displays the message – Analysing the chart…
You can of course elect to switch these messages off, and they are only included to alert you to possible set ups occurring.
Installation
Open your NinjaTrader 8 platform and select a chart.
Right click the chart to bring up a menu which looks like the following image:
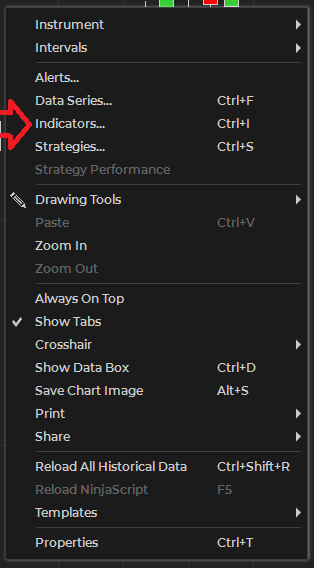
Select Indicators… which will open the following window. Alternatively, you can open this window by clicking the Indicators button in the chart toolbar or by pressing Ctrl + I while focused on the chart.
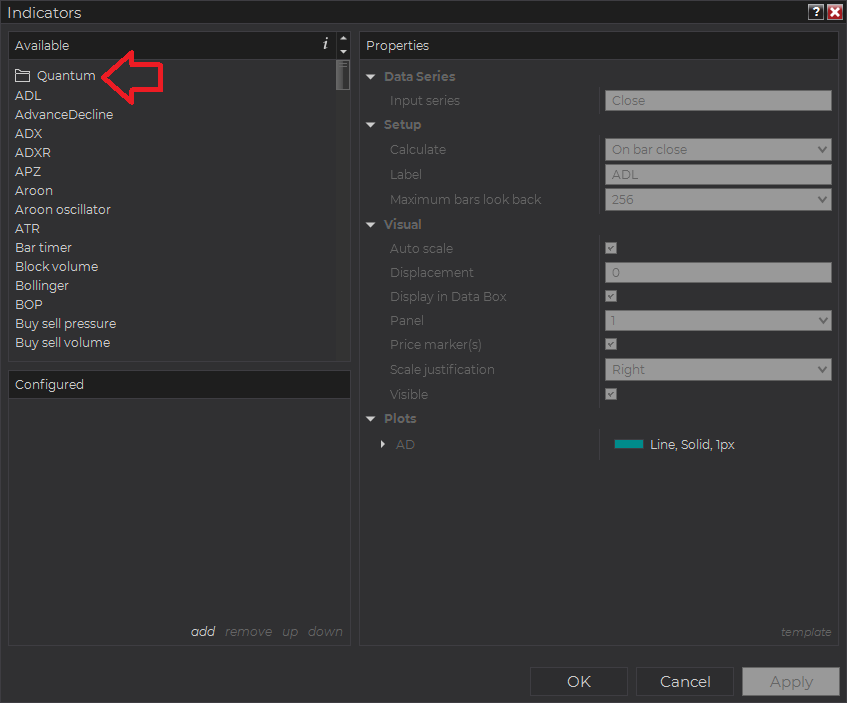
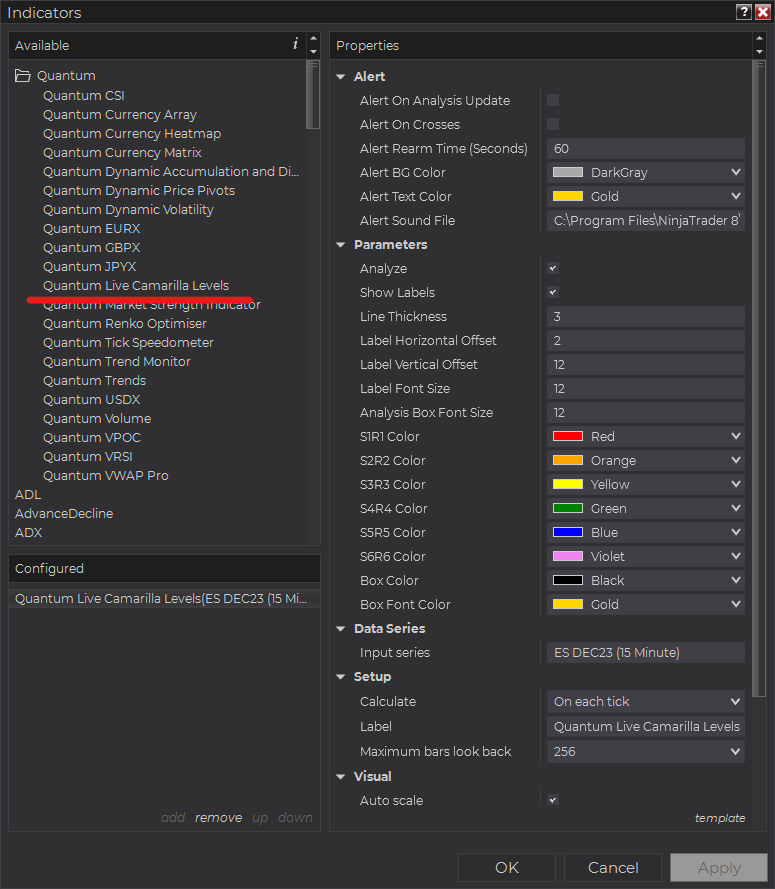
In the Indicators window under Available section, go to Quantum > Quantum Live Camarilla Levels and click it to select the indicator. Once selected, click “add” under the Configured section which will put it on the list of active indicators to be added in the chart.
Before clicking the OK or Apply button to complete, the indicator has several configurable options. You can click the Apply button at any time, and this will apply any changes you have made to the indicator without closing the window. This will allow you to see the changes you have made to the indicator, without closing with the OK button or the Cancel button.
Configuration
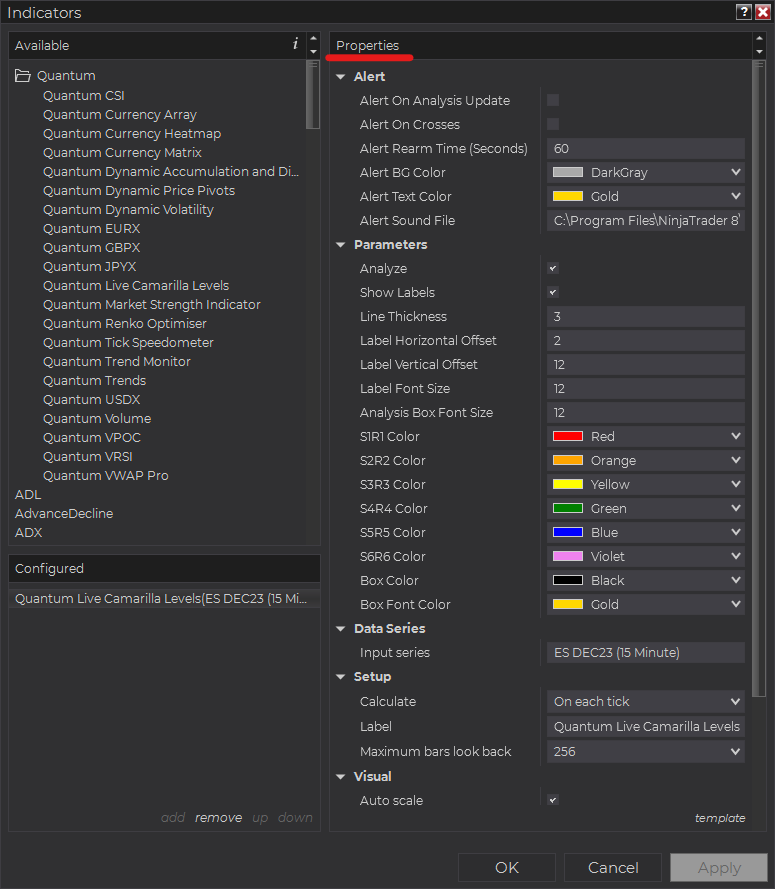
All user input can be configured at the right-hand side of the Indicators window under the Properties section. These are the default settings when you add the indicator in a chart.
Main Settings
Alert
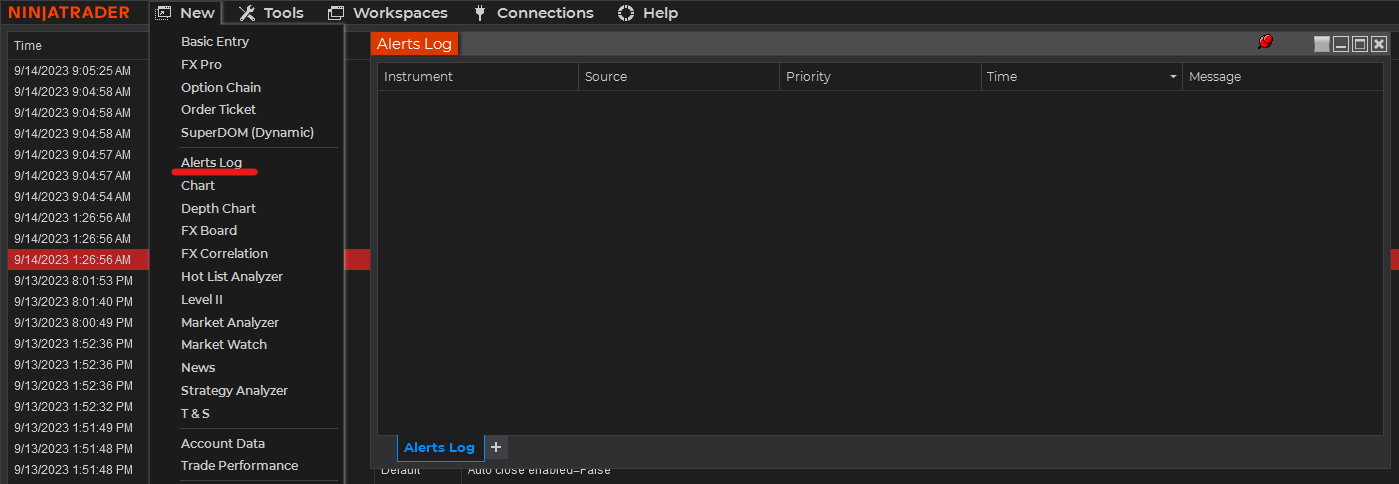
The following settings affect the indicator’s alert notifications displayed in the Alerts Log. You can open the Alerts Log from your NinjaTrader 8 client’s menu bar in the main window at New > Alerts Log.
Alert On Analysis Update
When enabled, the indicator sends an alert notification in the Alerts Log when the message in the Analysis Box changes.
Alert On Crosses
When enabled, the indicator sends an alert notification in the Alerts Log when price crosses any of the 12 Camarilla Levels.
Alert Rearm Time (Seconds)
This adds a delay to the next alert notification, expressed in number of seconds.
Alert BG Color
This setting allows you to customize the background color of the indicator’s messages as they appear in the Alerts Log.
Alert Text Color
This setting allows you to customize the color of the text as the indicator’s messages appear in the Alerts Log.
Alert Sound File
You can change here the sound file the platform uses when this indicator triggers an alert. By default, it uses the Alert1.wav file packaged with your NinjaTrader installation. Please make sure that the file is supported and the absolute path to the sound file is entered correctly.
Parameters
Analyze
Quantum Live Camarilla Levels constantly analyzes price movement and displays it as a message in a box located at the top left corner of the chart. If you prefer to turn off this feature, you can un-tick this setting to hide the box.
Show Labels
To help you identify which level is which, we have added labels at the end of each line. You can hide these labels by un-ticking this setting.
Line Thickness
You can increase or decrease the thickness of all the lines by changing this field’s value in the range of 1 to 5.
Label Horizontal Offset
You can adjust the value of this property to move the line label horizontally. Increasing its value moves the label to the left and decreasing it moves the label to the right.
Label Vertical Offset
You can adjust the value of this property to move the line label vertically. Increasing its value moves the label upwards and decreasing it moves the label downwards.
Label Font Size
Sets the text size of the line labels.
Analysis Box Font Size
Sets the text size of the messages in the Analysis Box.
S1R1 Color
Sets the color of the S1 and R1 Camarilla levels.
S2R2 Color
Sets the color of the S2 and R2 Camarilla levels.
S3R3 Color
Sets the color of the S3 and R3 Camarilla levels.
S4R4 Color
Sets the color of the S4 and R4 Camarilla levels.
S5R5 Color
Sets the color of the S5 and R5 Camarilla levels.
S6R6 Color
Sets the color of the S6 and R6 Camarilla levels.
Box Color
Sets the background color of the Analysis Box.
Box Font color
Sets the color of the text of the messages in the Analysis Box.
Other Settings
Data Series
Input Series
Opens the indicator Input Series dialogue which allows you to select the source of data for your indicator’s calculations.
Setup
Calculate
Sets the frequency at which the indicator performs its calculations.
Label
The label of the indicator’s instance displayed on the chart.
Maximum bars look back
Determines the maximum number of bars the indicator can look back to perform calculations on historical data. This is set to 256 by default (the most memory-friendly setting), but it can be changed to “infinite” to allow for a greater look back period.
Visual
Auto scale
When enabled, the indicator will be included in the chart panel’s vertical automatic scaling.
Displacement
Sets the number of bars by which to displace the indicator plots.
Display in Data Box
Enables or disables the inclusion of the indicator’s plot values in the Data Box
Panel
Sets the panel in which the indicator is plotted. If you select “Same as input series,” the indicator will be linked to the Input Series and automatically move if the Input Series is modified to a different panel.
Price marker(s)
When enabled, the indicator value is plotted in the axis selected under the “Scale Justification” property.
Scale justification
Sets the scale on which the indicator will be plotted. Possible values are “Right,” “Left,” and “Overlay”.
Visible
Enables or disables visibility and function of the indicator on the chart.
Unloading the indicator
Here are the steps to remove the indicator in the chart.
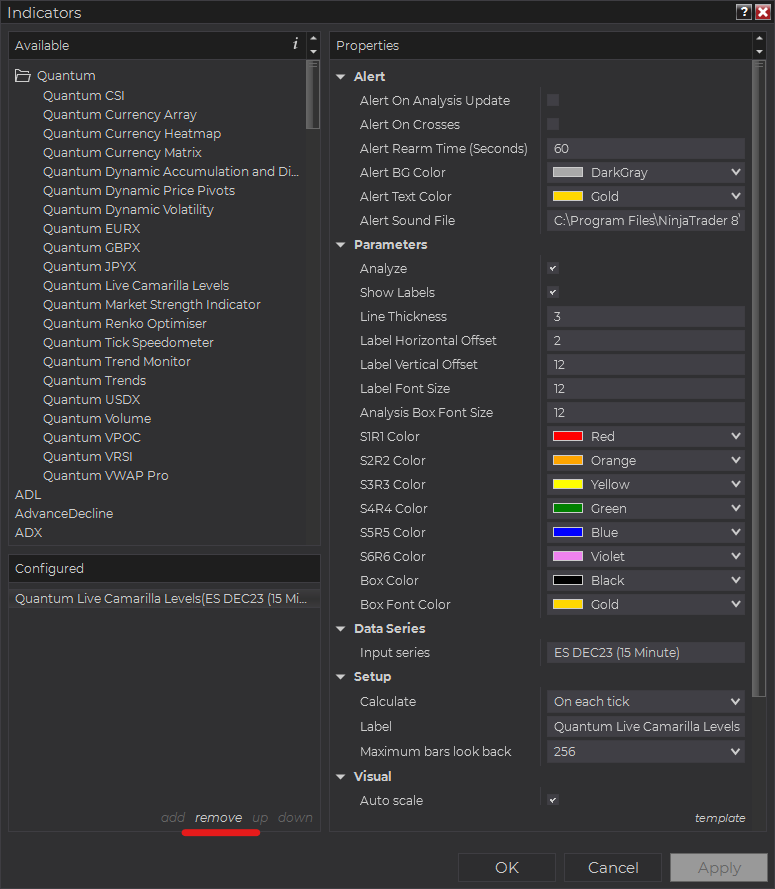
Right-click on the chart then select Indicators… from the menu. Select Quantum Live Camarilla Levels from the Configured section and click “remove” then OK to confirm and the indicator should be unloaded from your chart.
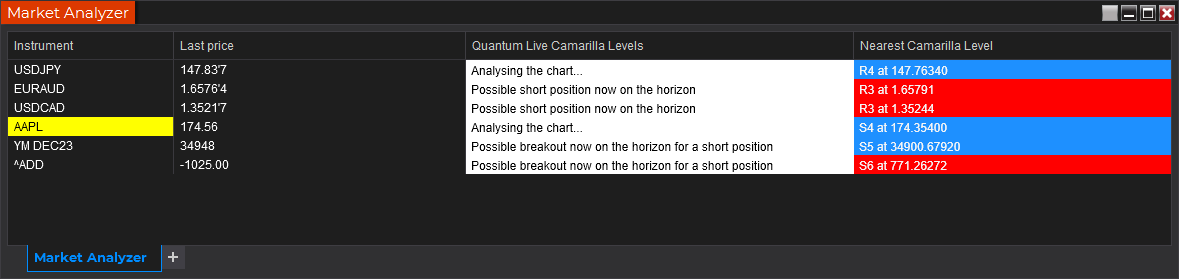
Using the Quantum Live Camarilla Levels in the NinjaTrader Market Analyzer
Valid Rows
The Quantum Live Camarilla Levels indicator works in any instrument.
Adding the Quantum Live Camarilla Levels as a Market Analyzer Column
Here are the basic steps to add the Quantum Live Camarilla Levels in the Market Analyzer:
Make sure valid rows are present in the Market Analyzer window.
Right-click anywhere in the Market Analyzer window then select “Columns…” in the context menu.
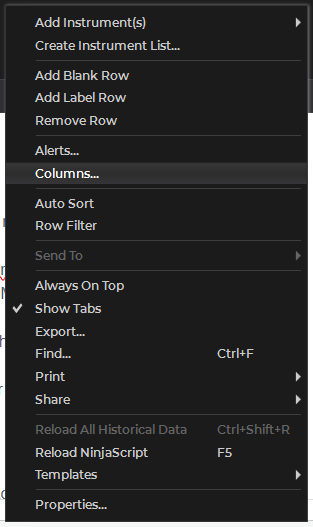
The Columns window appears. In the Available section, go to QuantumMarketAnalyzerColumns folder then double-click the Quantum Live Camarilla Levels to add the indicator as one of the columns in the Market Analyzer.
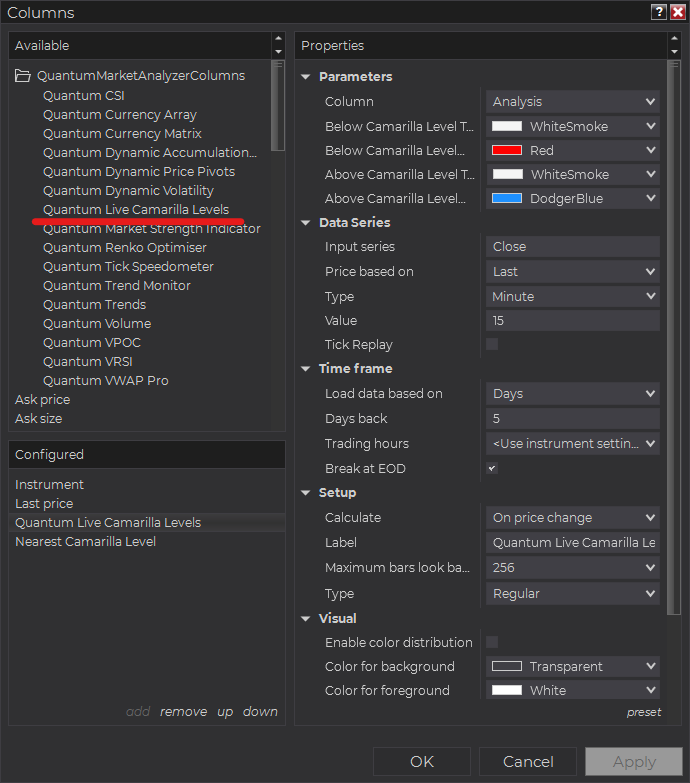
Select the type of information you like to display using the Column drop down menu under the Properties section of the indicator.
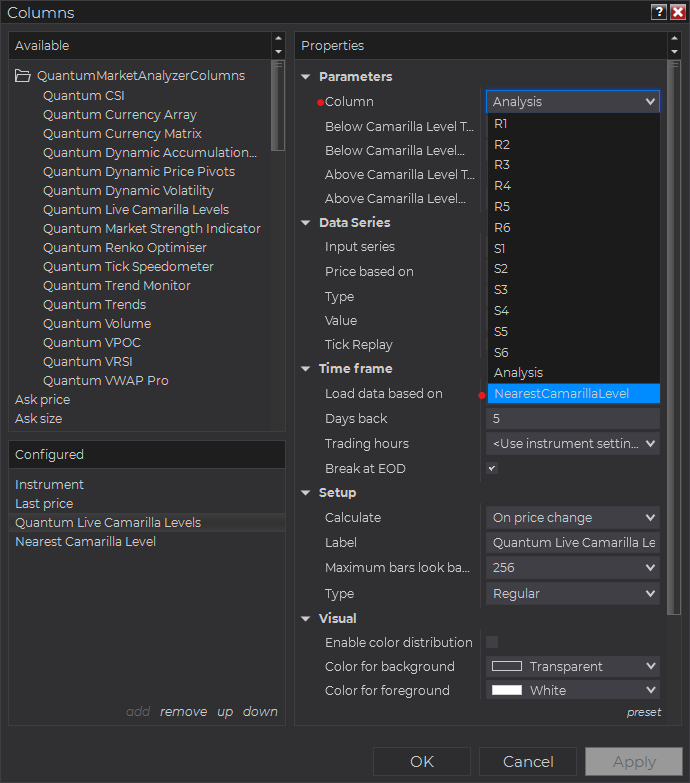
Set the timeframe of the indicator in Properties > Data Series section with the following user inputs:
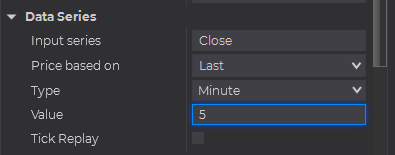
Type – select a time-based series such as Minute or Day
Value – set the interval for the type of series selected above
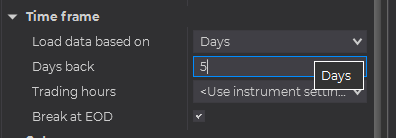
When running the indicator in timeframes less than Hourly intervals, please configure the “Load data based on” property to “Days” and the “Days back” property to the default value of 5 days to ensure that there is enough data for the indicator to work with.
After you have finished all your configurations, click OK to confirm your chosen settings and to add the indicator as a column in your Market Analyzer window.
Column Options
The Quantum Live Camarilla Levels is a multi-faceted indicator that can display different types of signals which can be selected through its Column drop down menu found under the Properties section. You can customize the indicator’s function in the Market Analyzer by selecting any of the options enumerated below.
- R1-R6 – these columns display the current price level of R1 to R6 Camarilla levels.
- S1-S6 – these columns display the current price level of S1 to S6 Camarilla levels.
- Analysis – displays the current message in the Camarilla indicator that interprets the position of the price among the 12 Camarilla levels.
Tip: You can change the Label property of the column to describe what type of signal you choose to display.


