


Description
Trading the currency markets is a complex business, not least since we are dealing with pairs of currencies, and by inference, pairs of economies. All economies around the world are interlinked, and reflected in the constant ebb and flow of currency strength and weakness. The problem for us as traders is monitoring so many pairs simultaneously, since every pair does not move independently, but reflects the interrelated nature of this market.
The amount of information can be overwhelming when we consider just the eight major currencies and the 28 currency pairs they then create. This is difficult enough, but when we view these on multiple timeframes, the numbers become unmanageable, and require arrays of multiple monitors and screens, simply to keep track. An almost impossible task.
This is one reason many forex traders struggle, and for three simple reasons.
First the technology and space required to track so many combinations of pairs is expensive and beyond the reach of many. Second, in focusing on one pair due to limited space and computer resource, opportunities are constantly missed as it is impossible to spot them across all the timeframes. Third and last, trading is all about managing risk.
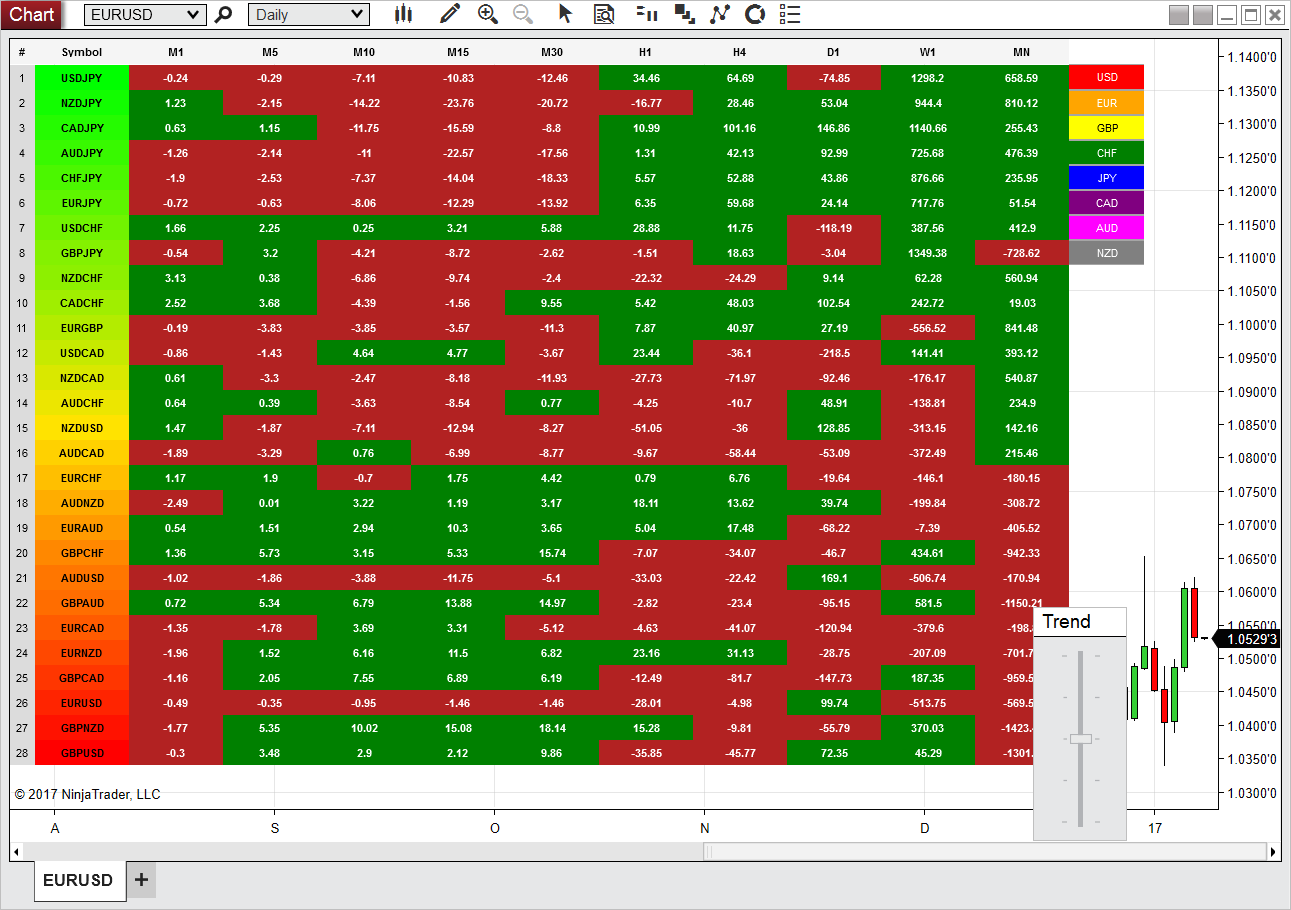
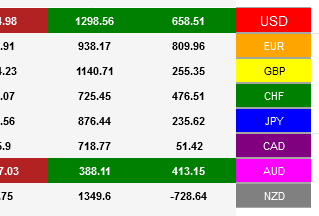
The Quantum Currency Heatmap delivers the information you need to base your trading decisions on the data of an entire spectrum of currency pairs derived from the 8 major currencies. Namely the US dollar, the euro, the British pound, the Swiss franc, the Japanese yen, the Canadian dollar, the Australian dollar and finally the New Zealand Dollar. In one clear, simple, and intuitive table, you can see instantly the entire weight of market sentiment across all 28 pairs, and across all the timeframes.
A global view of risk and sentiment on one chart in two dimensions! Vertically in the ranking table, and then horizontally across the horizon of time. Instant, simple and powerful.
No multiple monitors, no multiple PCs, no crowded screens, no chasing from one timeframe to another and back again. It is all here allowing you to make instant decisions in seconds for every major currency pair. Never miss another opportunity. Never struggle to find opportunities, and with all the information you need to make decisions across the timeframes.
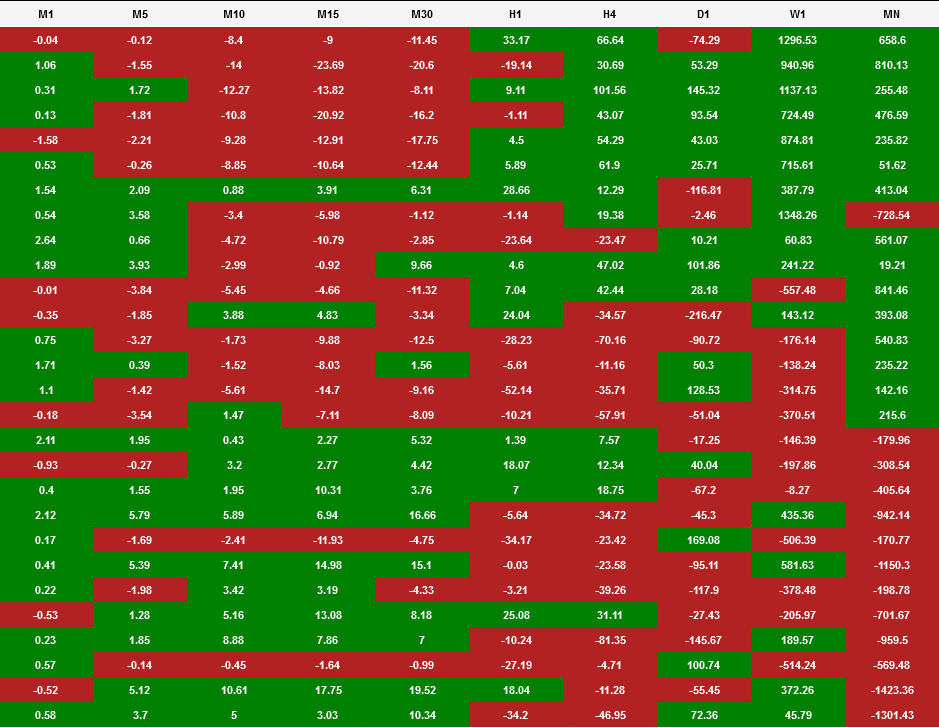
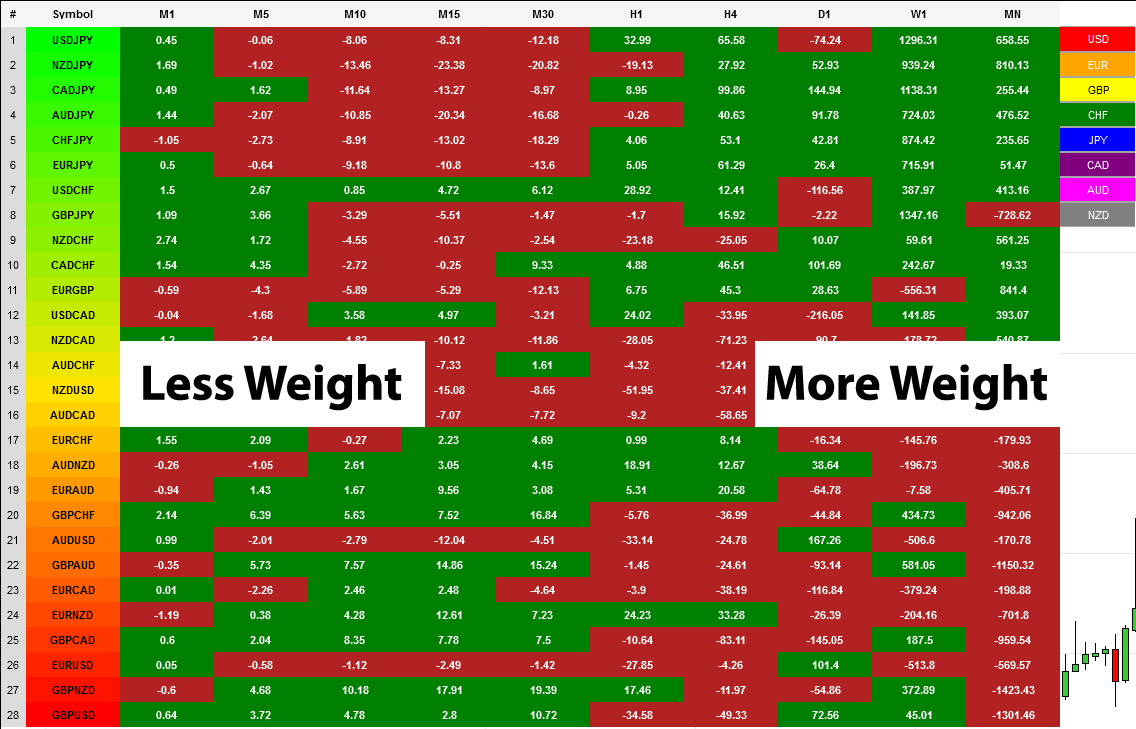
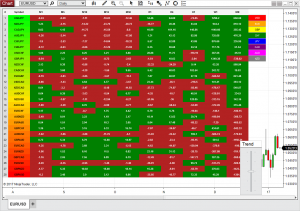
The Quantum Currency Heatmap instantly displays the “hottest” and “coldest” areas of the forex landscape. Vertically, 28 currency pairs are listed which are ranked from the most bullish pair (top) to the most bearish pair (bottom) and which pull the data from the Quantum Currency Matrix. And this is where it gets interesting: horizontally, the performance scores of each currency pair are displayed in 9 timeframes which are 1 minute, 5 minutes, 15 minutes, 30 minutes, hourly, 4 hours, daily, weekly, and monthly.
Each cell of the Quantum Currency Heatmap is color-coded which makes it possible to interpret it instantly with just a glance, much like looking at a sophisticated thermal imagery scanner, but for forex. If you check out the indicator, you’ll see how easy and intuitive the layout is, but let’s just expand on it here.
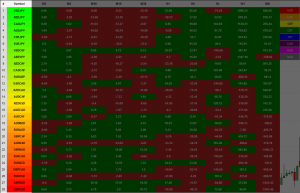
If we start with the performance scores. This is the value the indicator assigns to each currency pair representing how positively or negatively its price moved over a certain period. It can be either of the two colors depending on its value, and this is the color coding used when viewing the currency pairs ACROSS the time horizon – the horizontal!
- Green – if the currency pair’s performance score is positive.
- Red – if the currency pair’s performance score is negative
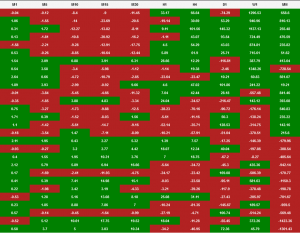
However, the pairs are then ranked VERTICALLY using a dynamic graded color code, transitioning from green, to yellow and to red in that order. The performance scores of the currency pairs in 9 timeframes are added together. The currency pairs are then ranked by their sum from the most positive to the most negative, and are color-coded as follows:
- Green shades – the sum of the currency pair’s performance scores in 9 timeframes, and weighted accordingly, is well above the fulcrum of zero.
- Yellow shades – the sum of the currency pair’s performance scores in 9 timeframes, and weighted accordingly, is relatively flat and around the fulcrum of 0. It can either be positive or negative but trails the numbers closest to 0.
- Red shades – the sum of the currency pair’s performance scores in 9 timeframes, and weighted accordingly, is well below the fulcrum of zero.
The gradation of color is dynamic. Hence the transition of colors will depend entirely on the sum of the currency pair’s performance scores in the 9 timeframes as explained above. As with all our other indicators, this is dynamic and is constantly shifting in real-time to reflect the ebb and flow of sentiment across the timeframes.
The indicator applies a weighting in the ranking ladder to reflect the fact that a trend in a slower timeframe has a greater significance than one in a faster timeframe.
Stepping back, the changing colors deliver a heatmap reflecting the relative performance of the 28 currency pairs across ALL timeframes in real-time. This gives a horizontal analysis of the currency pairs across time. This is immensely powerful and empowers you as a trader to make clear, logical, and fast decisions. The heatmap makes the complex world of forex, simple and clear. One workspace delivering information from 252 charts!
By itself, the Quantum Currency Heatmap indicator is a powerful trading tool for identifying trading opportunities, quickly, and easily on a single chart. However, its development is part of a new indicator bundle that we like to call the Quantum Currency Dashboard which consists of the following indicators:
- Quantum Currency Strength Indicator
- Quantum Currency Matrix
- Quantum Currency Array
- Quantum Currency Heatmap
These four indicators provide a unique, powerful, and compact insight into all the various aspects of strength and weakness for both currencies and currency pairs, from trend and momentum to overbought and oversold. What is unique is that using four charts, you are then able to monitor the myriad combinations of strength, weakness, momentum, congestion and divergence across the entire forex complex at the click of a button. No more missed opportunities, no more struggling with multiple charts, and no more trader regret, whatever your trading style or approach.
Interpreting 28 currency pairs and 9 timeframes worth of trading signals at once has never been this easy! So what are you waiting for? Grab yourself a Quantum Currency Heatmap and jump into the hottest trading opportunities as they develop in real-time.