Introduction
The VWAP indicator is another of our suite of volume indicators and one which was first referred to in 1988 when it appeared in an article entitled “The Total Cost Of Transactions On The NYSE” in the March edition of the Journal Of Finance from that year, which went on to explain its importance, particularly from an institutional perspective, which underpins its significance in appreciating the power and importance of this indicator.
In many ways, it is akin to the volume price analysis methodology itself, as we are merely attempting to follow the footprints in the sand left by their passage and described by volume. The same is true here, but in this case, we are following the institutions in much the same way.
Originally, the VWAP indicator was developed as a benchmark to measure whether an institutional customer received a fair execution of their order by the broker buying and selling on their behalf. The difference between the reported price and the VWAP gave the customer a benchmark against which to judge whether they had received a fair price or not. A portfolio manager for example, wants to know how the price they paid compared to the average price of the stock during the time it took to fill the order. If an order is filled at a worse price than the VWAP, it raises questions as to the ability of the broker. If the broker purchased a million shares at $40.50 and the VWAP during this time was at $40.70, the customer is likely to be happy since they paid 20 cents less than ‘fair value’. Equally, if the stock were purchased above, at, say $40.90 per share, the customer would consider this a poor trade, paying well above the fair value price at the VWAP.
The simplicity of this easy-to-understand benchmark, which creates this fair value price concept, has led to its wholehearted adoption amongst the institutions, and moreover, why algorithmic VWAP orders now dominate institutional market activity. A huge percentage of institutional orders are executed as VWAP orders, which raises two key questions. First of all, why, and second, how can we benefit from using the indicator?
If we start with the why, according to reports from the leading market makers, almost 40% of orders are now executed on this basis as they attempt to obtain a buy or sell price close to or better than the VWAP during the time it takes to complete the buy or sell order. These orders, therefore, help to hugely reinforce the importance of the VWAP since it is the guiding principle on which these orders are based. Even Warren Buffet uses VWAP, as evidenced when he sold his entire position in Southwest Airlines over two days, holding 2.3 million shares.
This highlights the key issues for any large institutional investor involving the price. If executed in a single order, an order to buy a large block of shares would almost certainly swamp the market, raising the price exponentially and, in addition, overwhelm the average volume traded in the day.
It is this issue of putting the price up against their own buying or conversely seeing the price fall as a result of their own selling that leads to the parent and child order scenario where significant block orders are broken into a multitude of smaller orders, which are duly executed over days, weeks or months. It is this aspect of institutional order execution that makes the VWAP such a potent indicator.
However, at Quantum Trading, we don’t just build a single indicator and leave it at that! We always take them to another level, and here we have done the same, bundling together a total of five indicators into one amazing value package so you can select your favorite from those on offer. The reason for this is we recognize the different ways the volume-weighted average price VWAP is used, which is why we offer a total of FIVE variants to choose from, and these are as follows:
- VWAP – Volume Weighted Average Price
- MVWAP – Moving Volume Weighted Average Price
- AVWAP – Anchored Volume Weighted Average Price
- TWAP – Time Weighted Average Price
- Interday Volume Weighted Average Price
All five variants include the option to display upper and lower bands that act as envelopes above and below the VWAP based on standard deviation, which you can adjust and set yourself. These price envelopes become essential dynamic support and resistance levels, which can help predict the extremes of price action as it oscillates around the VWAP from the fastest to the slowest timeframes and everything in between.
All five indicators are packaged into one powerful indicator, which we have named the Quantum VWAP Pro indicator for obvious reasons, and as you would expect, it works in all markets and instruments, whether stocks, futures, ETFs, forex or cryptocurrencies.
Finally, as with all our indicators, we recommend you use it in multiple timeframes.
Variants
VWAP: Volume-Weighted Average Price

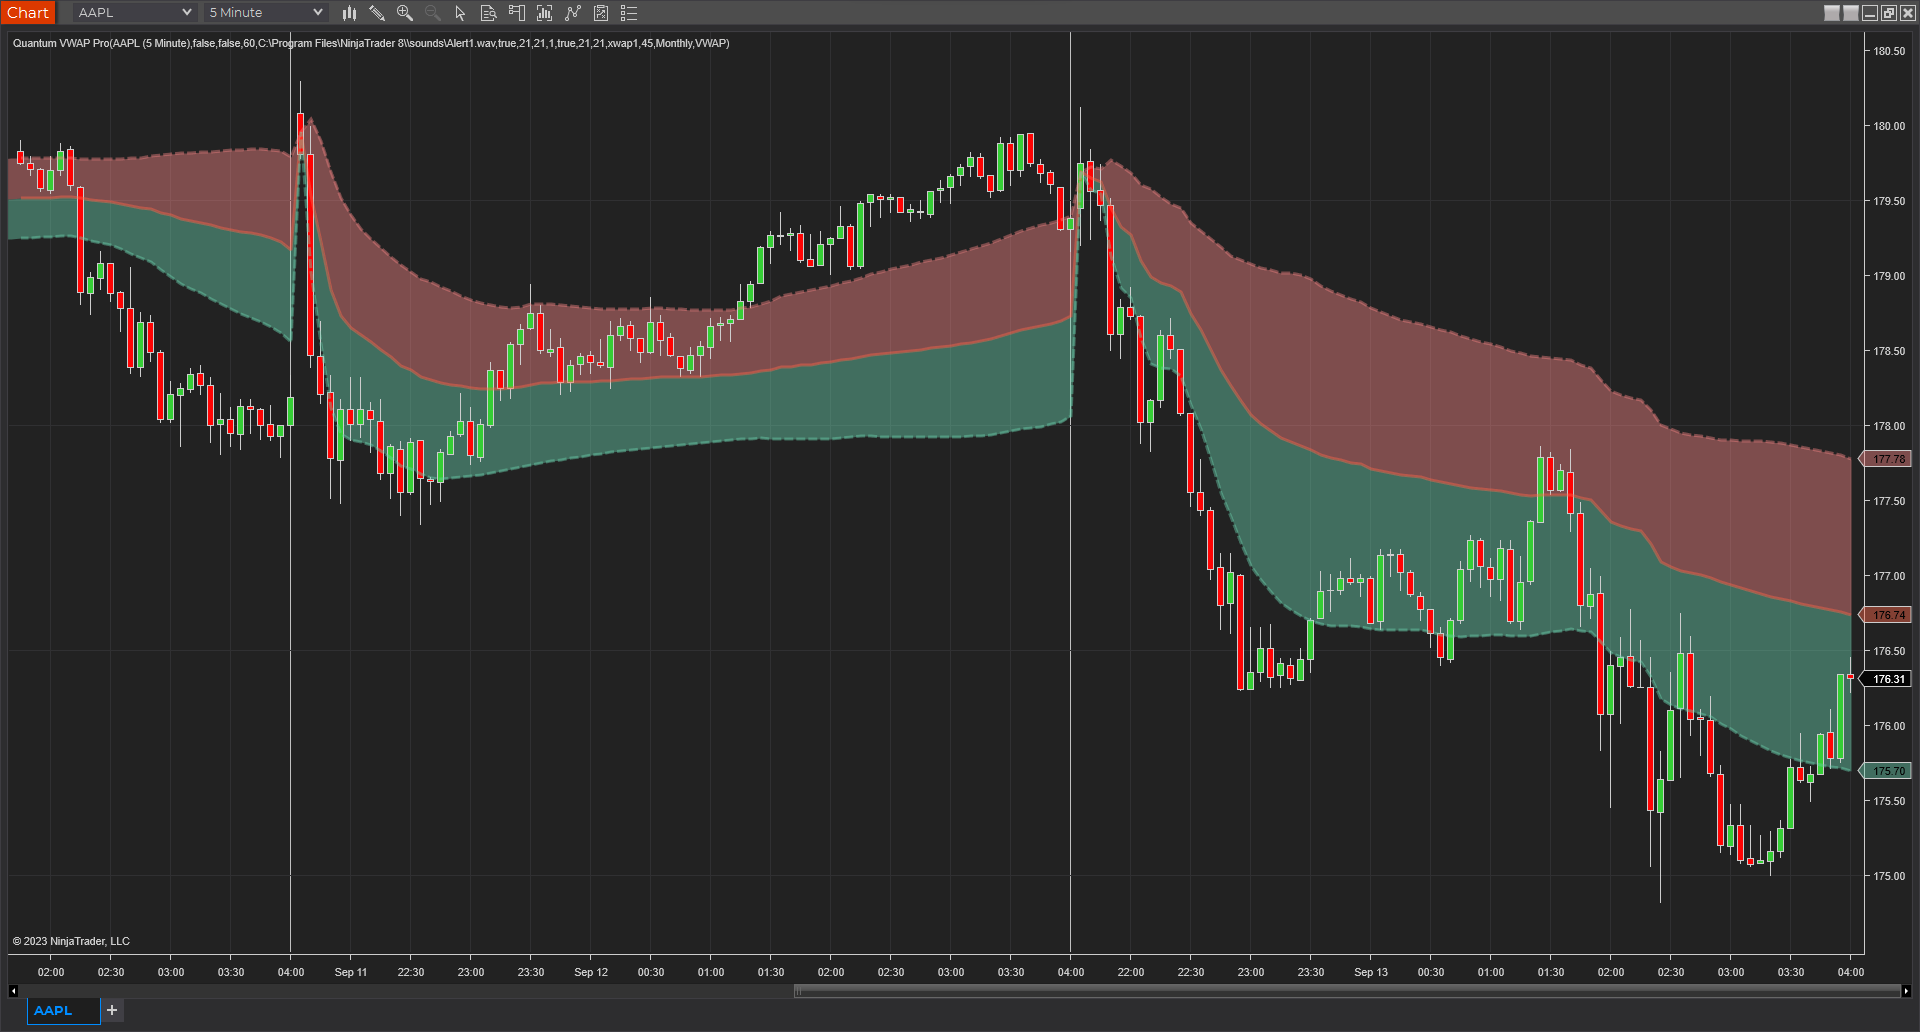
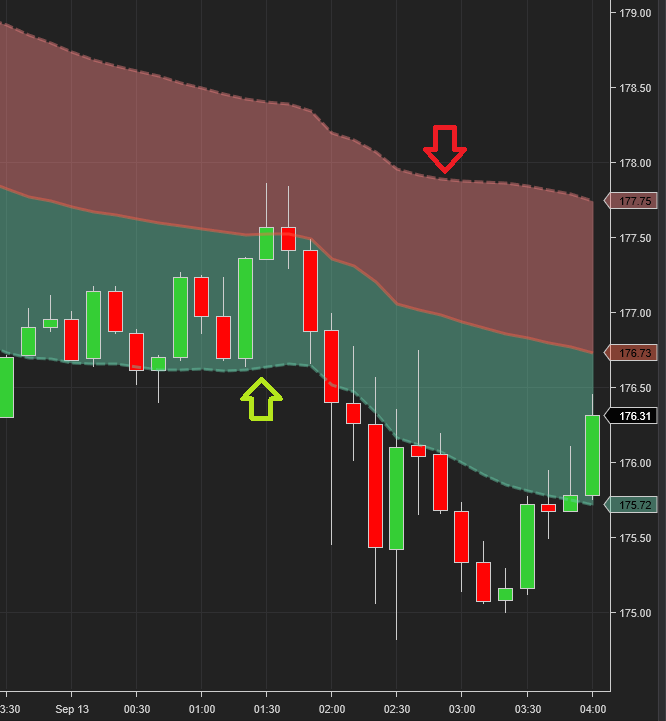
The VWAP or Volume-Weighted Average Price is a technical analysis tool that displays the average price of an instrument weighted by volume. It appears as a single line like a moving average but smoother. It can either be used as a dynamic support/resistance level or a “magnetic” level where price oscillates.
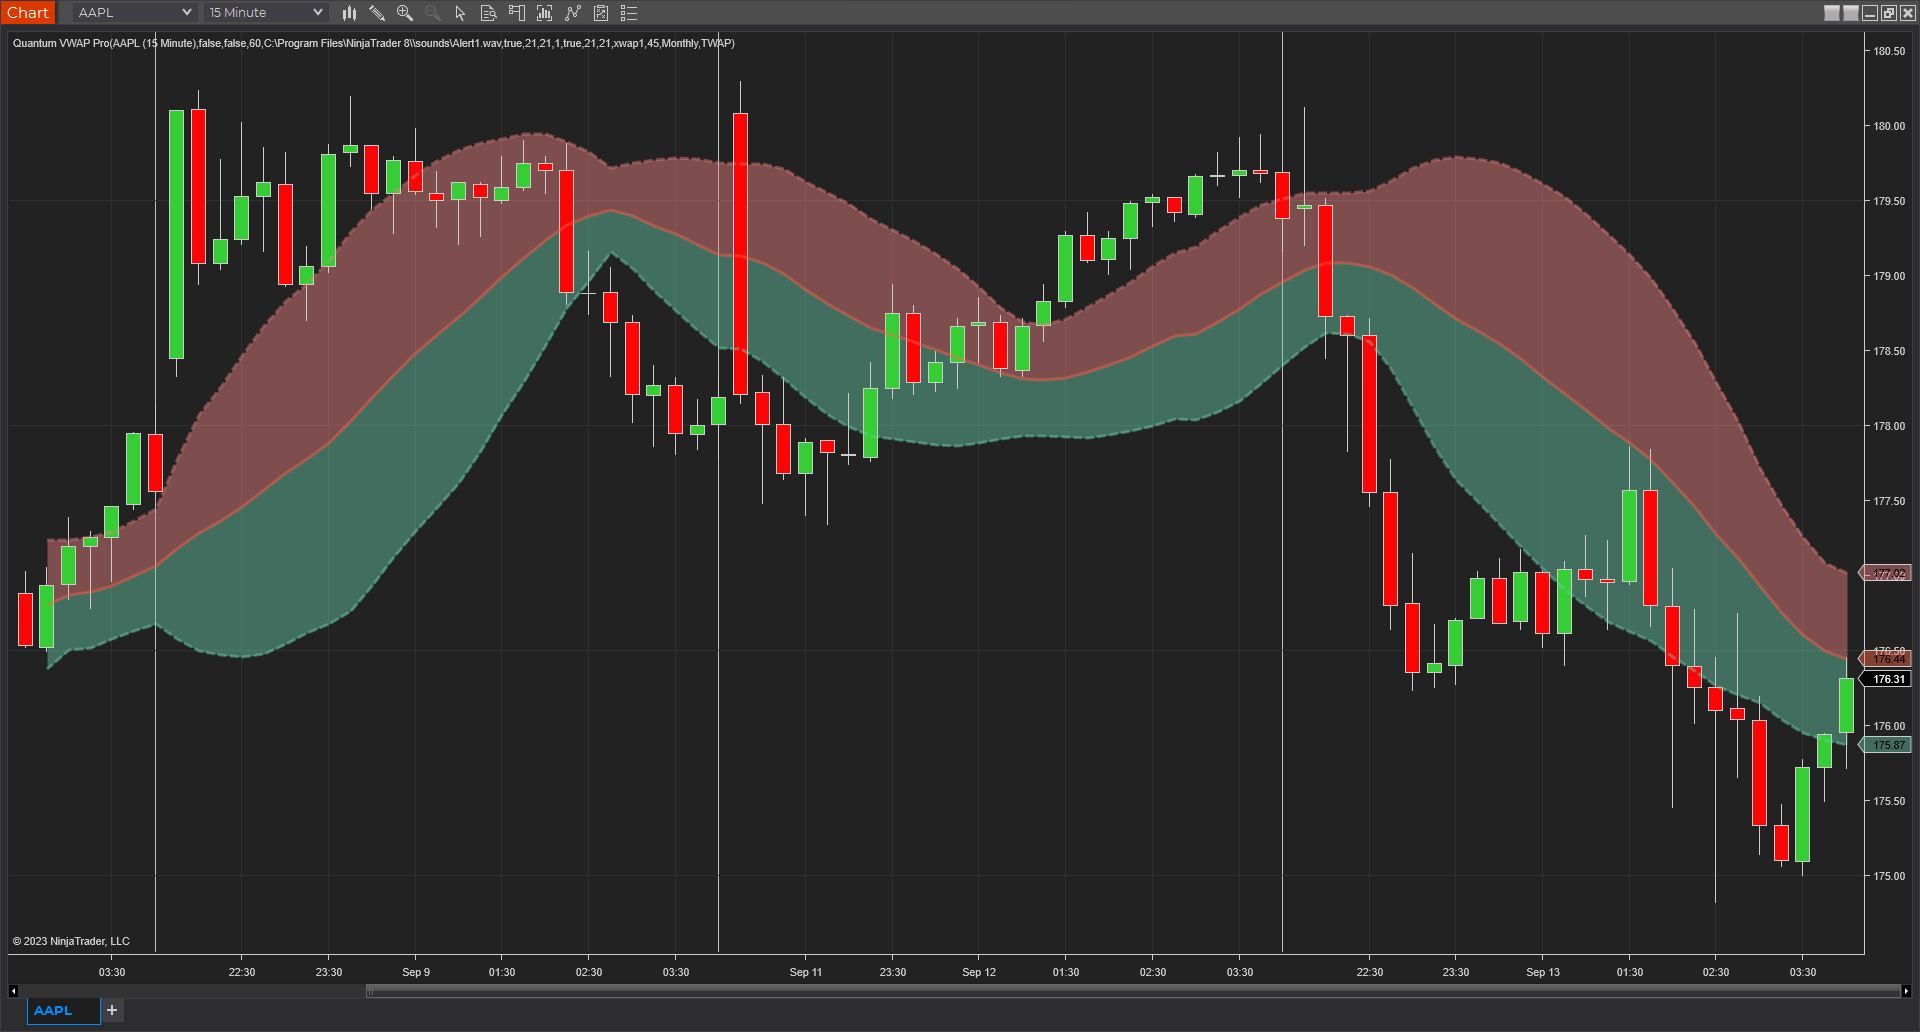
The “VWAP” variant of the VWAP Pro indicator calculates the volume-weighted average price of an instrument within each day and resets as it passes the last bar of the intraday period. It anchors itself at the first bar of the new day and its lines fan out in 3 directions once again, repeating the cycle. From the central VWAP line, it plots 2 additional lines or “bands” at the top and bottom and are calculated as 1 standard deviation from the VWAP line and they can be adjusted using the multiplier variable in the indicator’s user inputs.
MVWAP: Moving Volume-Weighted Average Price
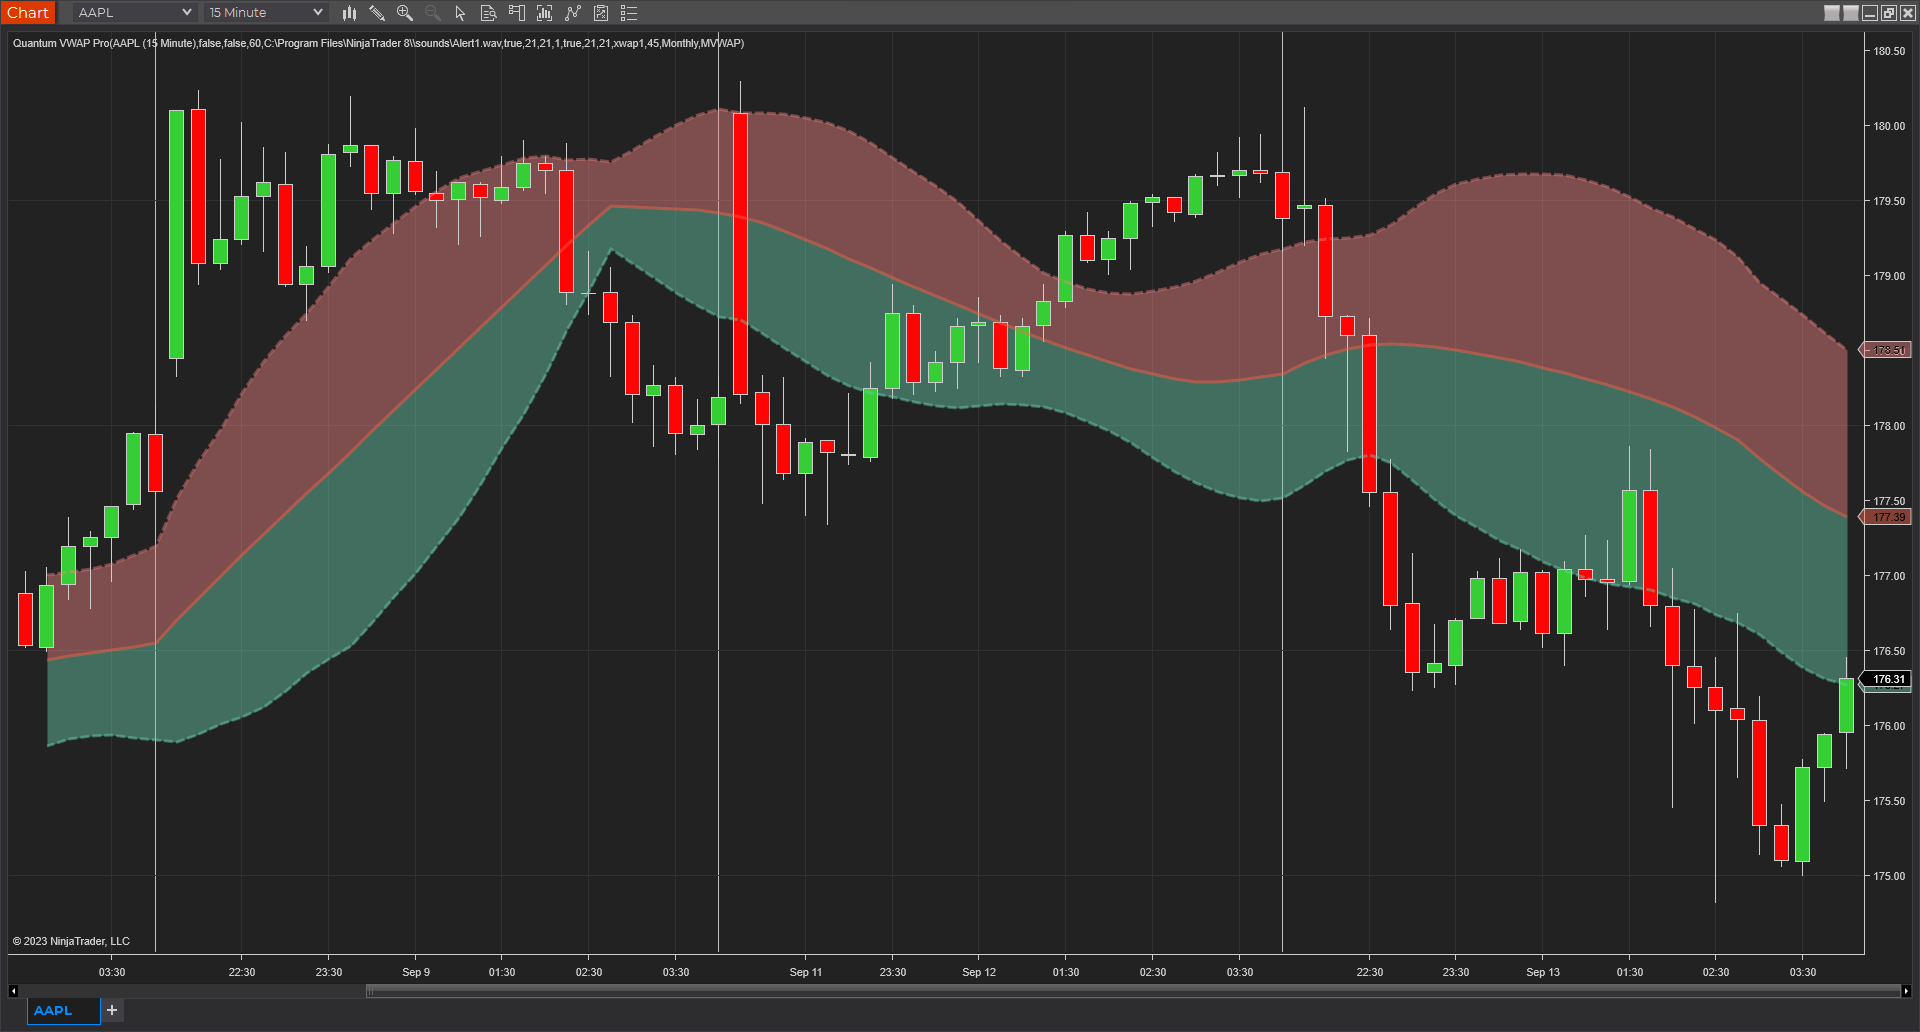
MVWAP stands for Moving Volume-Weighted Average Price and is one of the variants available in the VWAP Pro indicator. It is calculated as the moving average of VWAP values within a certain length of time. In most ways, MVWAP has the same qualities as the VWAP variant, but the difference lies between sessions where there are no anchors or resets. There exists a continuity between time periods and sessions and because it is an average of VWAP values, you can customize it such that its length of calculation can be shortened to be made more responsive to price action or smooth out noise with longer lengths.
AVWAP: Anchored Volume-Weighted Average Price
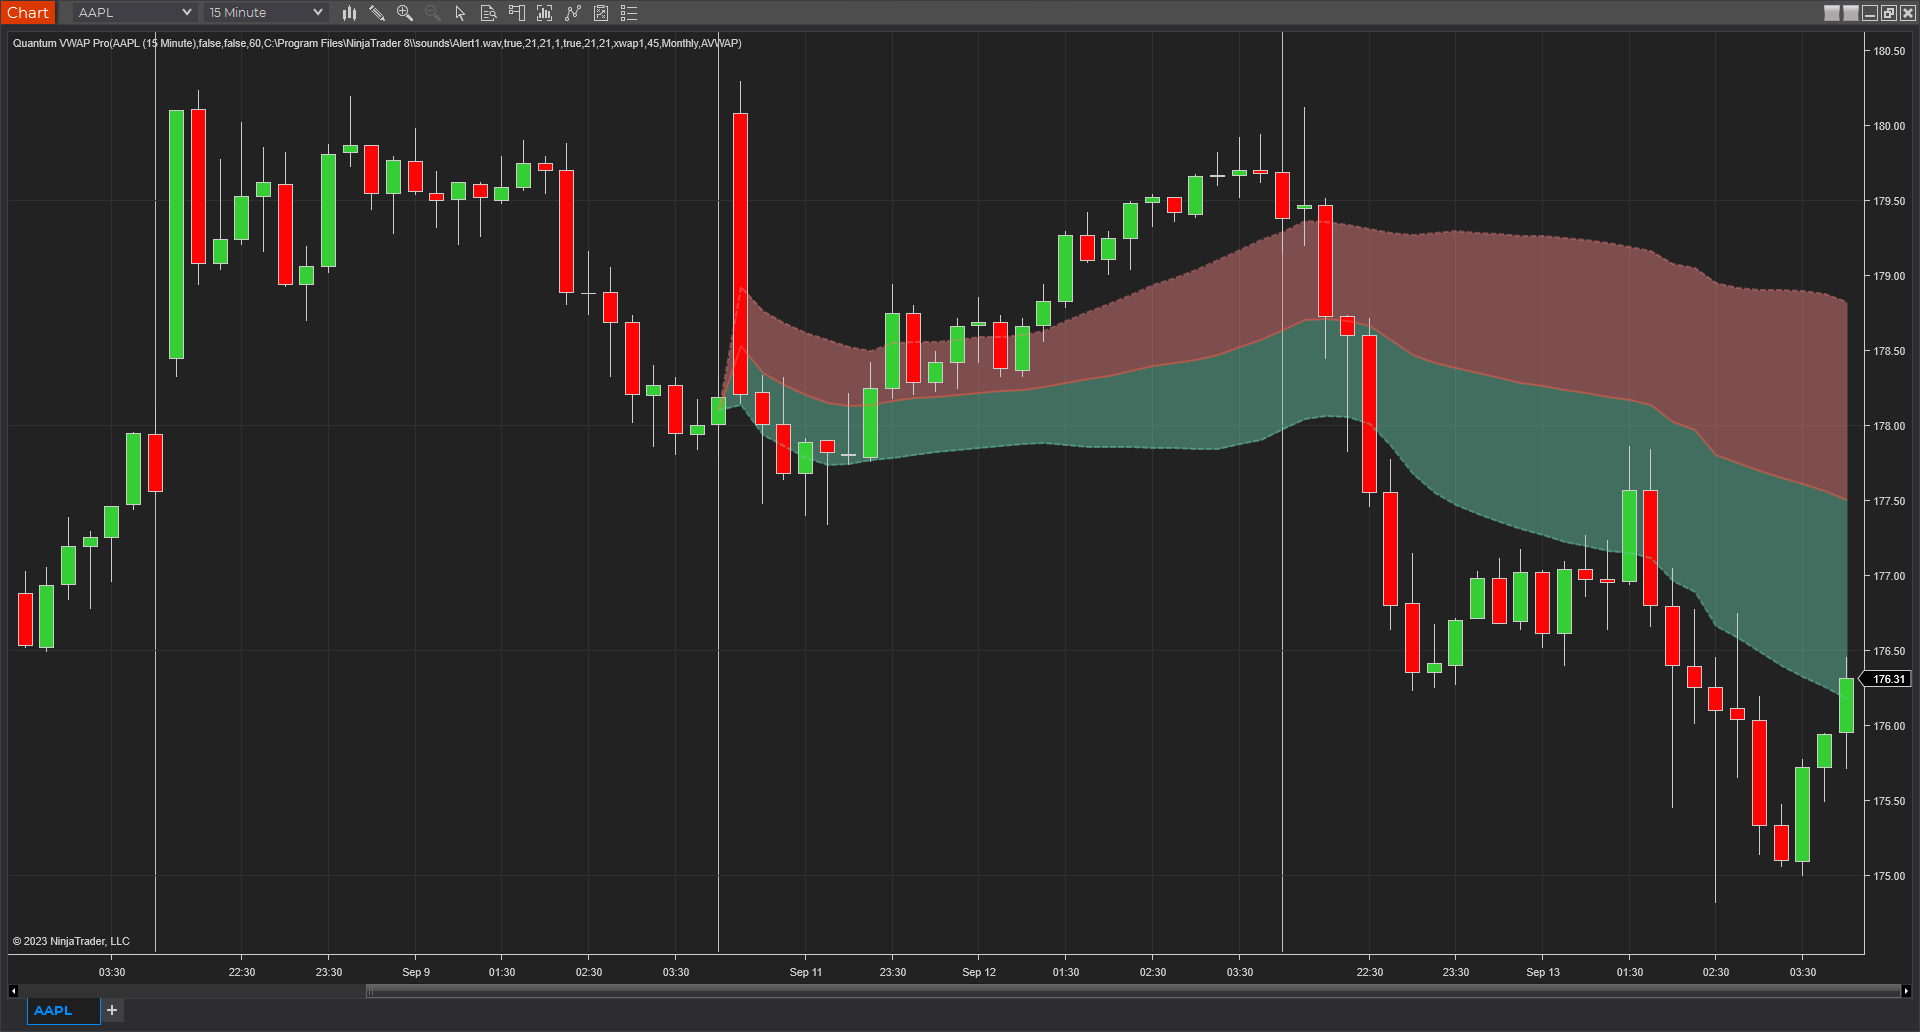
Just as its name implies, what makes the AVWAP or the Anchored Volume-Weighted Average Price unique compared to other variants is it allows you to choose the starting point of the calculation. If the basic VWAP “anchors” its calculations at the start of every daily session then the AVWAP gives you the choice of where to set its singular point of origin by simply clicking a data point in the chart’s bar history. This flexibility offers great opportunities to trade news releases, announcements, candlestick patterns and other significant events that affect the market by placing the anchor at such meaningful time points.
TWAP: Time-weighted Average Price
The Time-Weighted Average Price or TWAP takes the average of the open, high, low, and close prices of a candlestick bar then averaging these further within a certain period and repeating this throughout the bar history. Unlike the other variants included in the VWAP Pro, the TWAP does not involve volume in its calculations, and it is purely based on price action, but it possesses the same elements such as a central line with upper and lower bands that run parallel to it. Due to its nature, its shape when laid on the chart appears to conform more tightly to price action. This offers an additional perspective to the VWAP Pro’s other volume-based variants. TWAP is unbiased in terms of volume and so for high-volume traders, TWAP is a great tool for placing large trades by breaking them into smaller orders that are executed over regular intervals near the TWAP value so as not to cause adverse effects on the market. For regular traders, it gives a useful perspective to the market’s price action especially in faster timeframes while coupled with VWAP Pro’s volume-based variants.
Interday VWAP: Interday Volume-Weighted Average Price
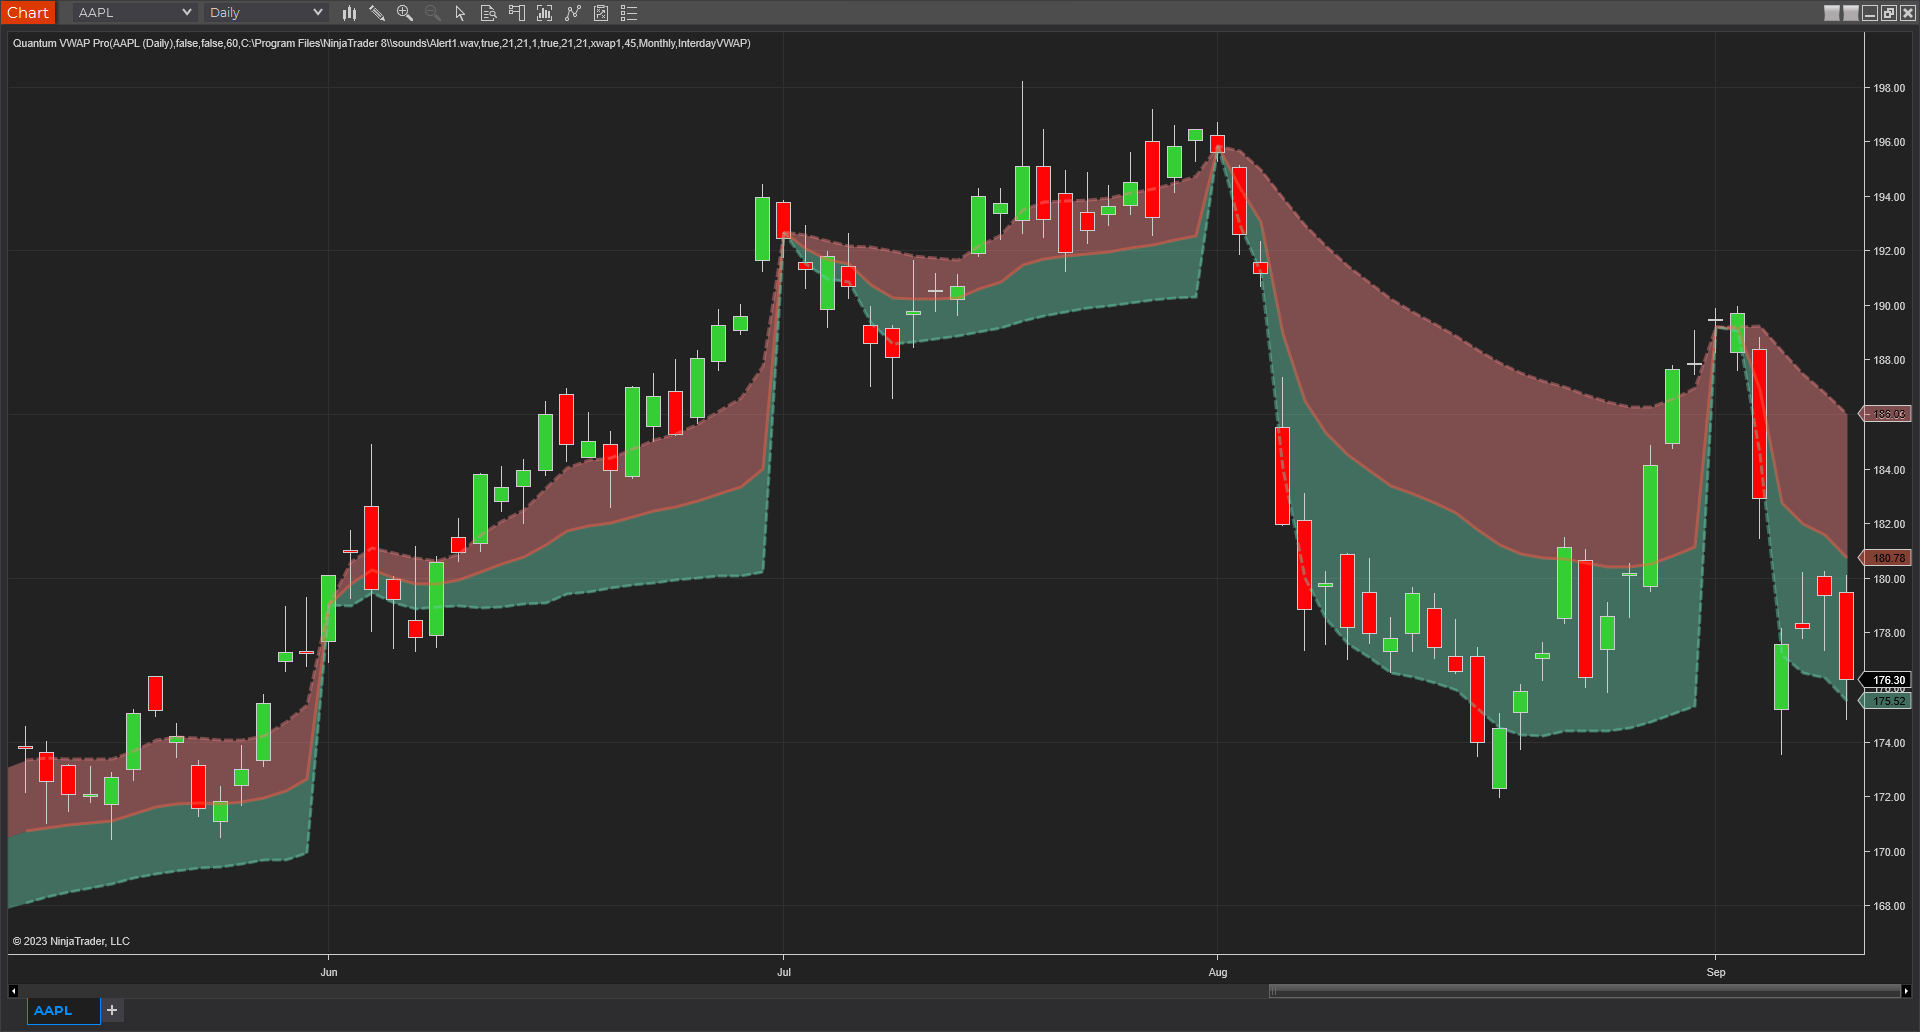
The Interday VWAP variant offers new trading opportunities to long term investors by scaling up the basic VWAP variant’s calculations from within daily sessions to longer timeframes. If VWAP traditionally anchors or resets its calculations at the beginning of the day, then the Interday VWAP variant anchors at longer periods which can be adjusted to something that suits the timeframe you are trading. You can choose to make the calculations span in Weekly, Monthly or Yearly intervals. This mode is also useful to short-term traders to check their trades to see whether they are riding the market’s overarching trend. It provides precious information on the look ahead showing how price action potentially plays out in the bigger picture.
Installation
Open your NinjaTrader 8 platform and select a chart.
Right click the chart to bring up a menu which looks like the following image:
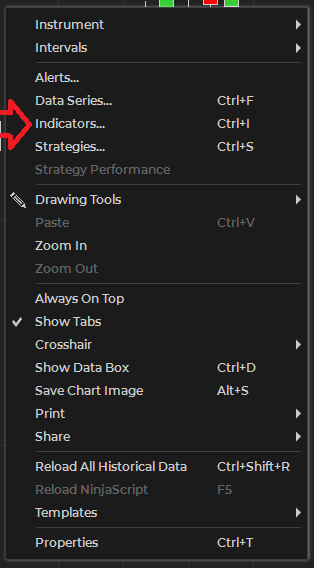
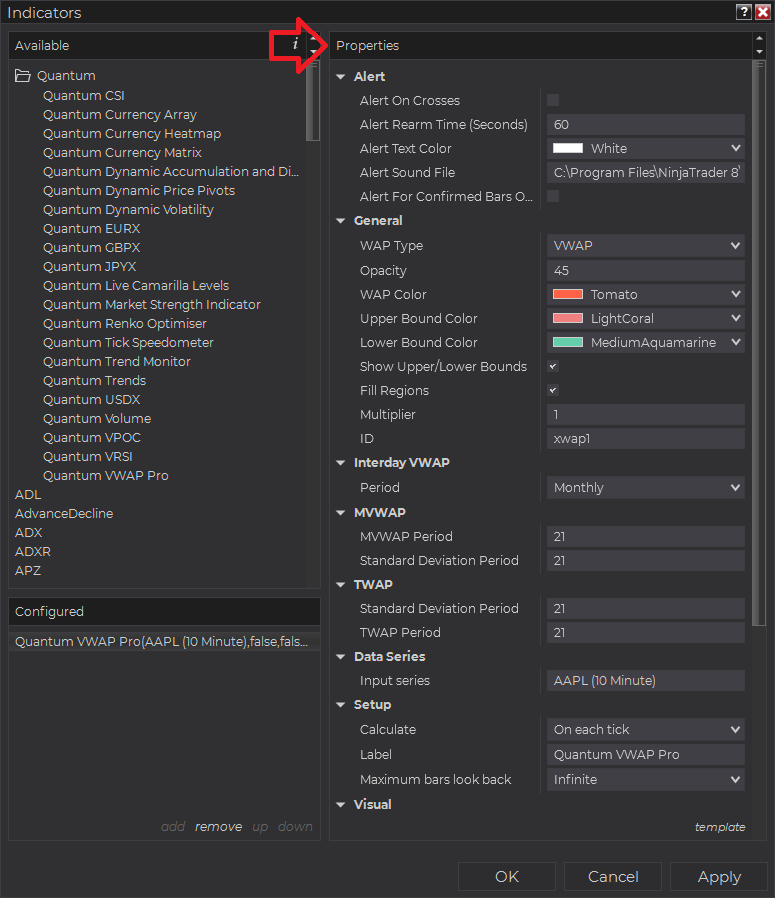
Select Indicators… which will open the following window. Alternatively, you can open this window by clicking the Indicators button in the chart toolbar or by pressing Ctrl + I while focused on the chart.
In the Indicators window under Available section, go to Quantum > Quantum VWAP Pro and click it to select the indicator. Once selected, click “add” under the Configured section which will put it on the list of active indicators to be added in the chart.
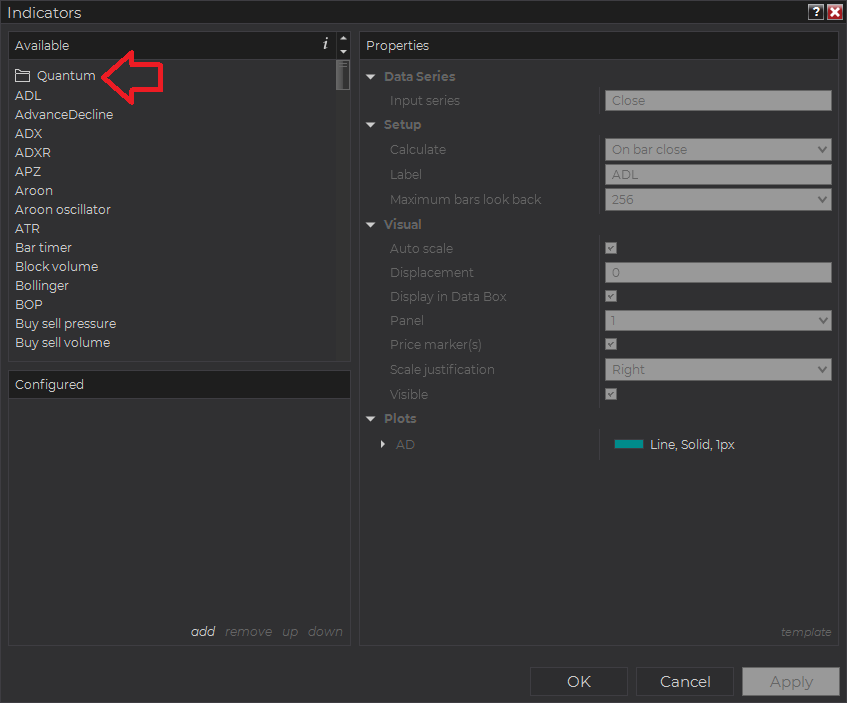
Before clicking the OK or Apply button to complete, the indicator has several configurable options. You can click the Apply button at any time, and this will apply any changes you have made to the indicator without closing the window. This will allow you to see the changes you have made to the indicator, without closing with the OK button or the Cancel button.
Configuration
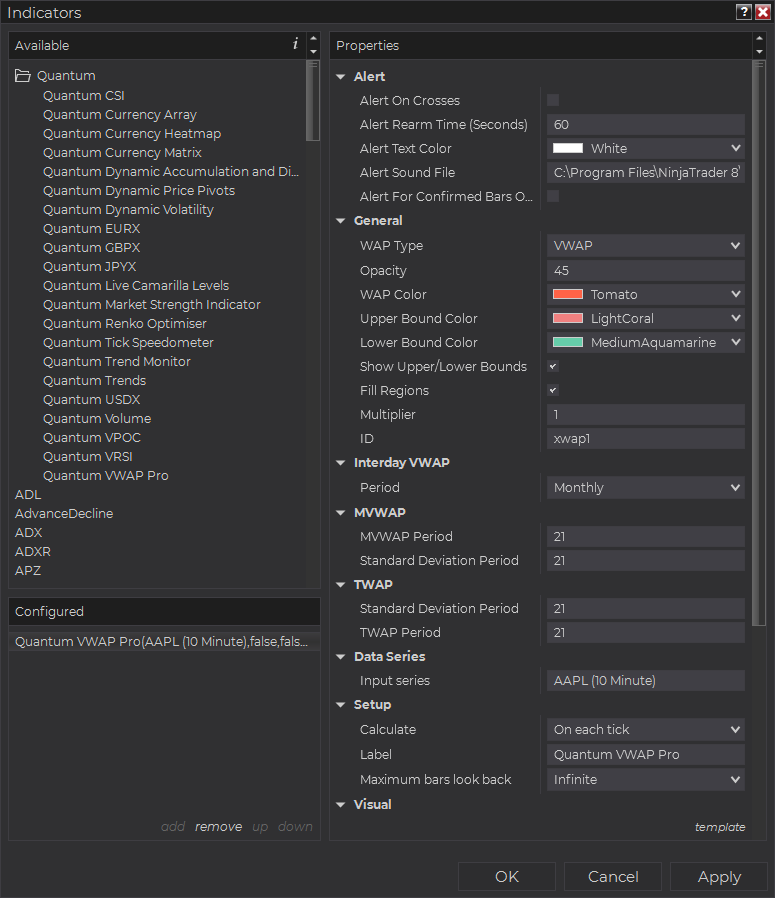
All user input can be configured at the right-hand side of the Indicators window under the Properties section. These are the default settings when you add the indicator in a chart.
Main Settings
Alert
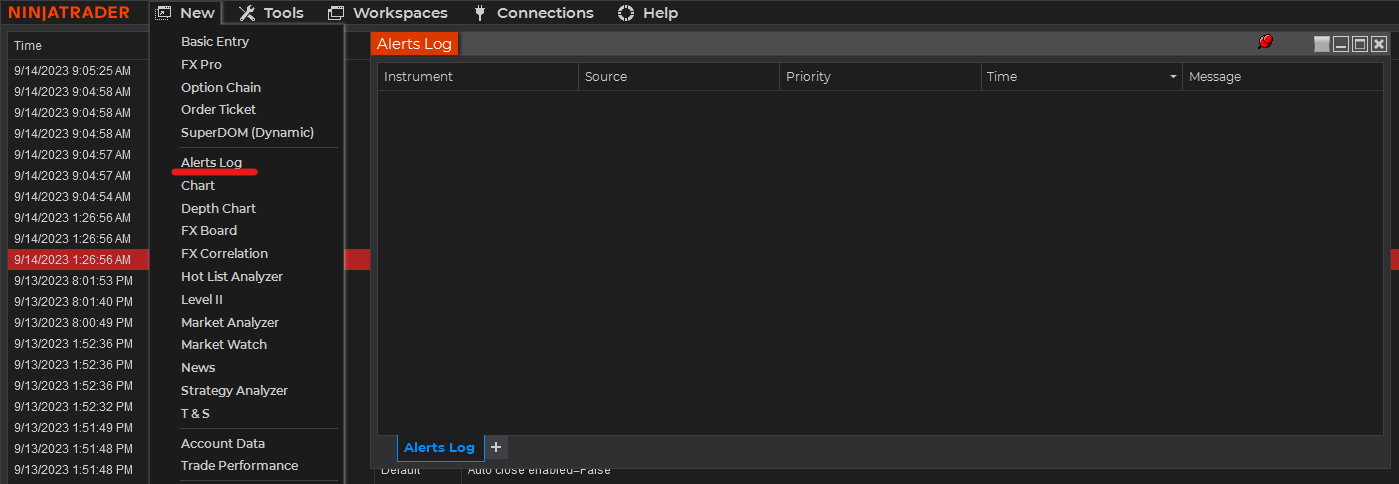
The following settings affect the indicator’s alert notifications displayed in the Alerts Log. You can open the Alerts Log from your NinjaTrader 8 client’s menu bar in the main window at New > Alerts Log.
Alert On Crosses
When enabled, the indicator sends an alert notification in the Alerts Log when price crosses the VWAP line, Upper Bound line, or the Lower Bound line.
Alert Rearm Time (Seconds)
This adds a delay to the next alert notification, expressed in number of seconds.
Alert Text Color
This setting allows you to customize the color of the text as the indicator’s messages appear in the Alerts Log.
Alert Sound File
You can change here the sound file the platform uses when this indicator triggers an alert. By default, it uses the Alert1.wav file packaged with your NinjaTrader installation. Please make sure that the file is supported and the absolute path to the sound file is entered correctly.
Alert For Confirmed Bars Only
If this setting is enabled, alerts are not triggered by signals on the open/forming bar. All bars that meet the condition must be closed to trigger an alert.
General
WAP Type
This setting sets which variant of the weighted average price is used. There are 5 options:
- VWAP – Volume-Weighted Average Price
- MVWAP – Moving Volume Weighted Average Price
- AVWAP – Anchored Volume Weighted Average Price
- TWAP – Time-weighted Average Price
- Interday VWAP – Interday Volume Weighted Average Price
Each variant is explained in detail above.
Opacity
This value defines the amount of transparency of the filled regions between the upper and lower bound lines. Its value ranges from 1 being very transparent to 100 which makes the regions completely opaque.
WAP Color
This is the color of the central line plot of the VWAP Pro indicator.
Upper Bound Color
This is the color of the upper bound line plot of the VWAP Pro indicator.
Lower Bound Color
This is the color of the lower bound line plot of the VWAP Pro indicator.
Show Upper/Lower Bounds
This setting shows/hides the upper and lower bound lines.
Fill Regions
This setting adds/removes the colored region between the upper and lower bound lines.
Multiplier
The multiplier in this setting is factored with the value of the upper and lower bound lines and by changing it, you can adjust the proximity of these lines from the main VWAP line. It also accepts decimal values as multipliers like 0.5 and 0.25.
ID
Changing this setting is mainly used when the WAP Type is set to AVWAP where the lines created are turned into drawing objects (from plots). You need to change the value of this setting when you need to run 2 instances of the VWAP Pro indicator (both in AVWAP mode) in the same chart.
Interday VWAP
Period
This setting refers to the time intervals that the VWAP Pro indicator will use when it is in Interday VWAP mode. There are 3 periods to choose from:
- Weekly – recommended when using Interday VWAP in a Daily timeframe
- Monthly – recommended when using Interday VWAP in Daily, multiple days, or weekly timeframe
- Yearly – recommended when using Interday VWAP in Monthly timeframe
MVWAP
MVWAP Period
As explained above, MVWAP is a moving average of VWAP values across a certain look back period. This setting is the number of bars that the indicator uses to get the average VWAP values to create the MVWAP line.
Standard Deviation Period
The upper and lower bound lines of the MVWAP use their own look back period which references this setting. Its default value matches its MVWAP Period which we find is the best starting point.
TWAP
Standard Deviation Period
The upper and lower bound lines of the TWAP also use their own look back period and reference this setting. Its default value matches its TWAP Period which we find is the best starting point.
TWAP Period
Like the MVWAP variant, the TWAP is also a moving average, but an average of OHLC prices across a certain look back period. This setting allows you to change the number of bars it takes in its calculation of the TWAP.
Other Settings
Data Series
Input Series
Opens the indicator Input Series dialogue which allows you to select the source of data for your indicator’s calculations.
Setup
Calculate
Sets the frequency at which the indicator performs its calculations.
Label
The label of the indicator’s instance displayed on the chart.
Maximum bars look back
Determines the maximum number of bars the indicator can look back to perform calculations on historical data. Please keep its value “infinite” to allow for a greater look back period.
Visual
Auto scale
When enabled, the indicator will be included in the chart panel’s vertical automatic scaling.
Displacement
Sets the number of bars by which to displace the indicator plots.
Display in Data Box
Enables or disables the inclusion of the indicator’s plot values in the Data Box
Panel
Sets the panel in which the indicator is plotted. If you select “Same as input series,” the indicator will be linked to the Input Series and automatically move if the Input Series is modified to a different panel.
Price marker(s)
When enabled, the indicator value is plotted in the axis selected under the “Scale Justification” property.
Scale justification
Sets the scale on which the indicator will be plotted. Possible values are “Right,” “Left,” and “Overlay”.
Visible
Enables or disables visibility and function of the indicator on the chart
Plots
Sets a variety of parameters, such as color, for the plots drawn by the indicator.
- WAP
- WAPUB1
- WAPLB1
Unloading the indicator
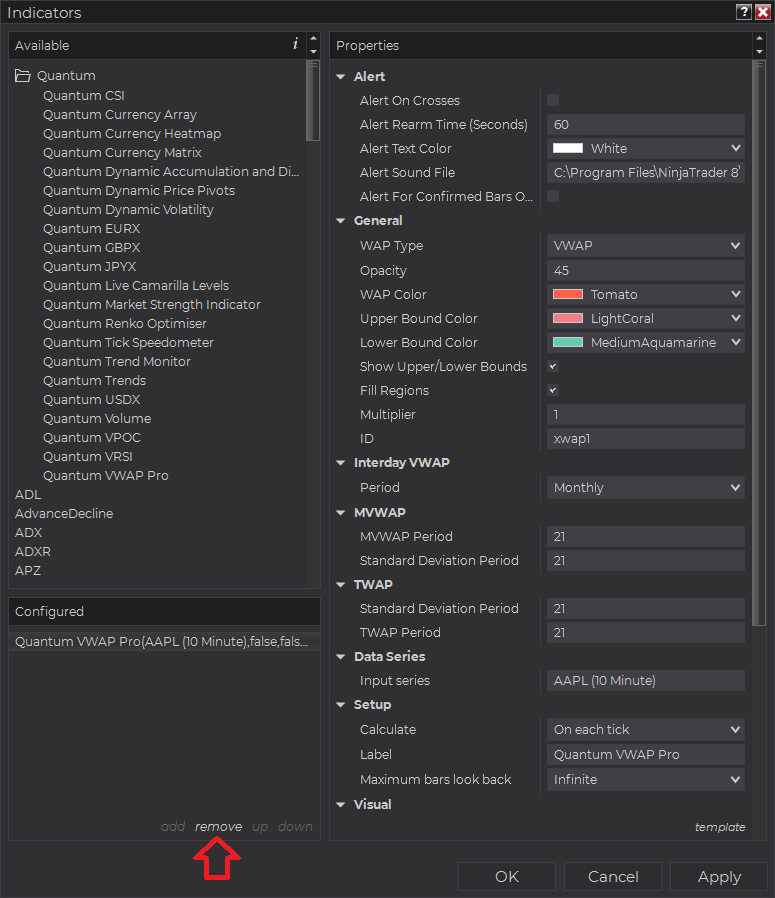
Here are the steps to remove the indicator in the chart.
Right-click on the chart then select Indicators… from the menu. Select Quantum VWAP Pro from the Configured section and click “remove” then OK to confirm and the indicator should be unloaded from your chart.
Using the Quantum VWAP Pro in the NinjaTrader Market Analyzer
Valid Rows
The Quantum VWAP Pro indicator works in any instrument with historical volume data.
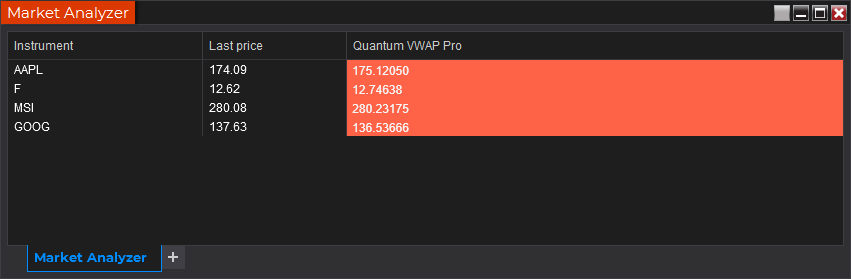
Adding the Quantum VWAP Pro as a Market Analyzer Column
Here are the basic steps to add the Quantum VWAP Pro in the Market Analyzer:
Make sure valid rows are present in the Market Analyzer window.
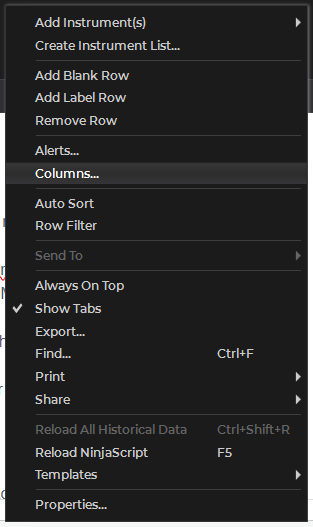
Right-click anywhere in the Market Analyzer window then select “Columns…” in the context menu.
The Columns window appears. In the Available section, go to QuantumMarketAnalyzerColumns folder then double-click the Quantum VWAP Pro to add the indicator as one of the columns in the Market Analyzer.
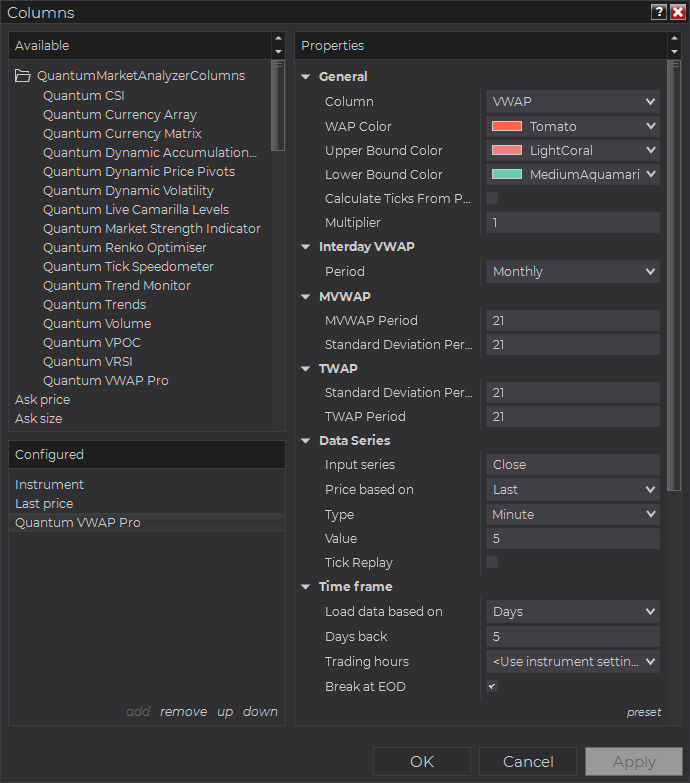
Select the type of information you like to display using the Column drop down menu under the Properties section of the indicator.
Set the timeframe of the indicator in Properties > Data Series section with the following user inputs:
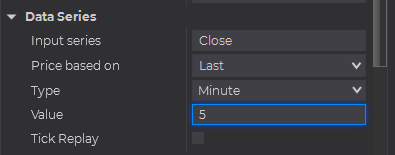
Type – select a time-based series such as Minute or Day
Value – set the interval for the type of series selected above
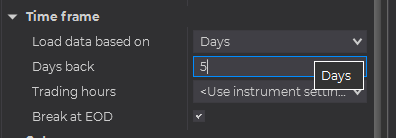
When running the indicator in timeframes less than Hourly intervals, please configure the “Load data based on” property to “Days” and the “Days back” property to the default value of 5 days to ensure that there is enough data for the indicator to work with.
After you have finished all your configurations, click OK to confirm your chosen settings and to add the indicator as a column in your Market Analyzer window.
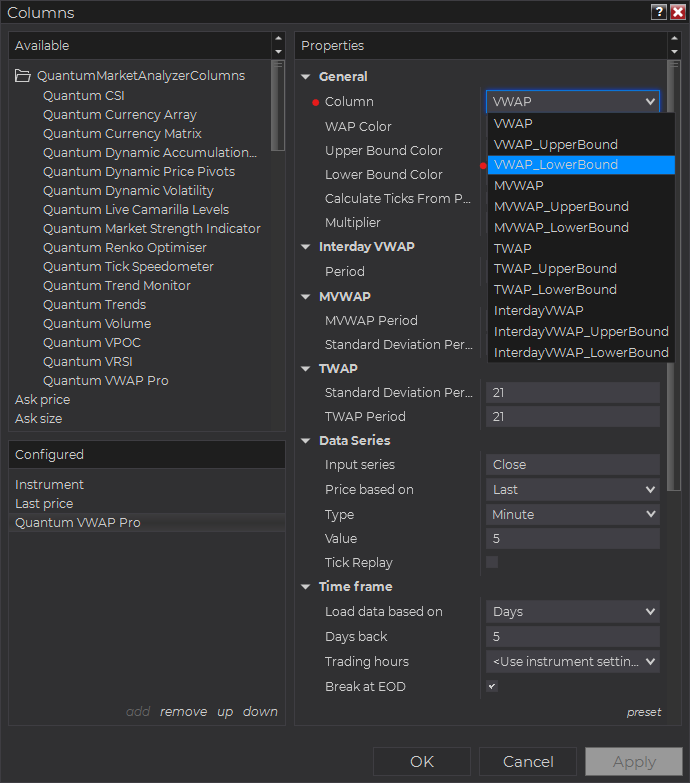
Column Options
The Quantum VWAP Pro is a multi-faceted indicator that can display different types of signals which can be selected through its Column drop down menu found under the Properties section. You can customize the indicator’s function in the Market Analyzer by selecting any of the options enumerated below.
- VWAP – displays the current price level of the VWAP line.
- VWAP_UpperBound – displays the current price level of the VWAP’s upper bound line.
- VWAP_LowerBound – displays the current price level of the VWAP’s lower bound line.
- MVWAP – displays the current price level of the MVWAP line.
- MVWAP_UpperBound – displays the current price level of the MVWAP’s upper bound line.
- MVWAP_LowerBound – displays the current price level of the MVWAP’s lower bound line.
- TWAP – displays the current price level of the TWAP line.
- TWAP_UpperBound – displays the current price level of the TWAP’s upper bound line.
- TWAP_LowerBound – displays the current price level of the TWAP’s lower bound line.
- InterdayVWAP – displays the current price level of the InterdayVWAP line.
- InterdayVWAP_UpperBound – displays the current price level of the InterdayVWAP’s upper bound line.
- InterdayVWAP_LowerBound – displays the current price level of the InterdayVWAP’s lower bound line.
Tip: You can change the Label property of the column to describe what type of signal you choose to display.


