Introduction
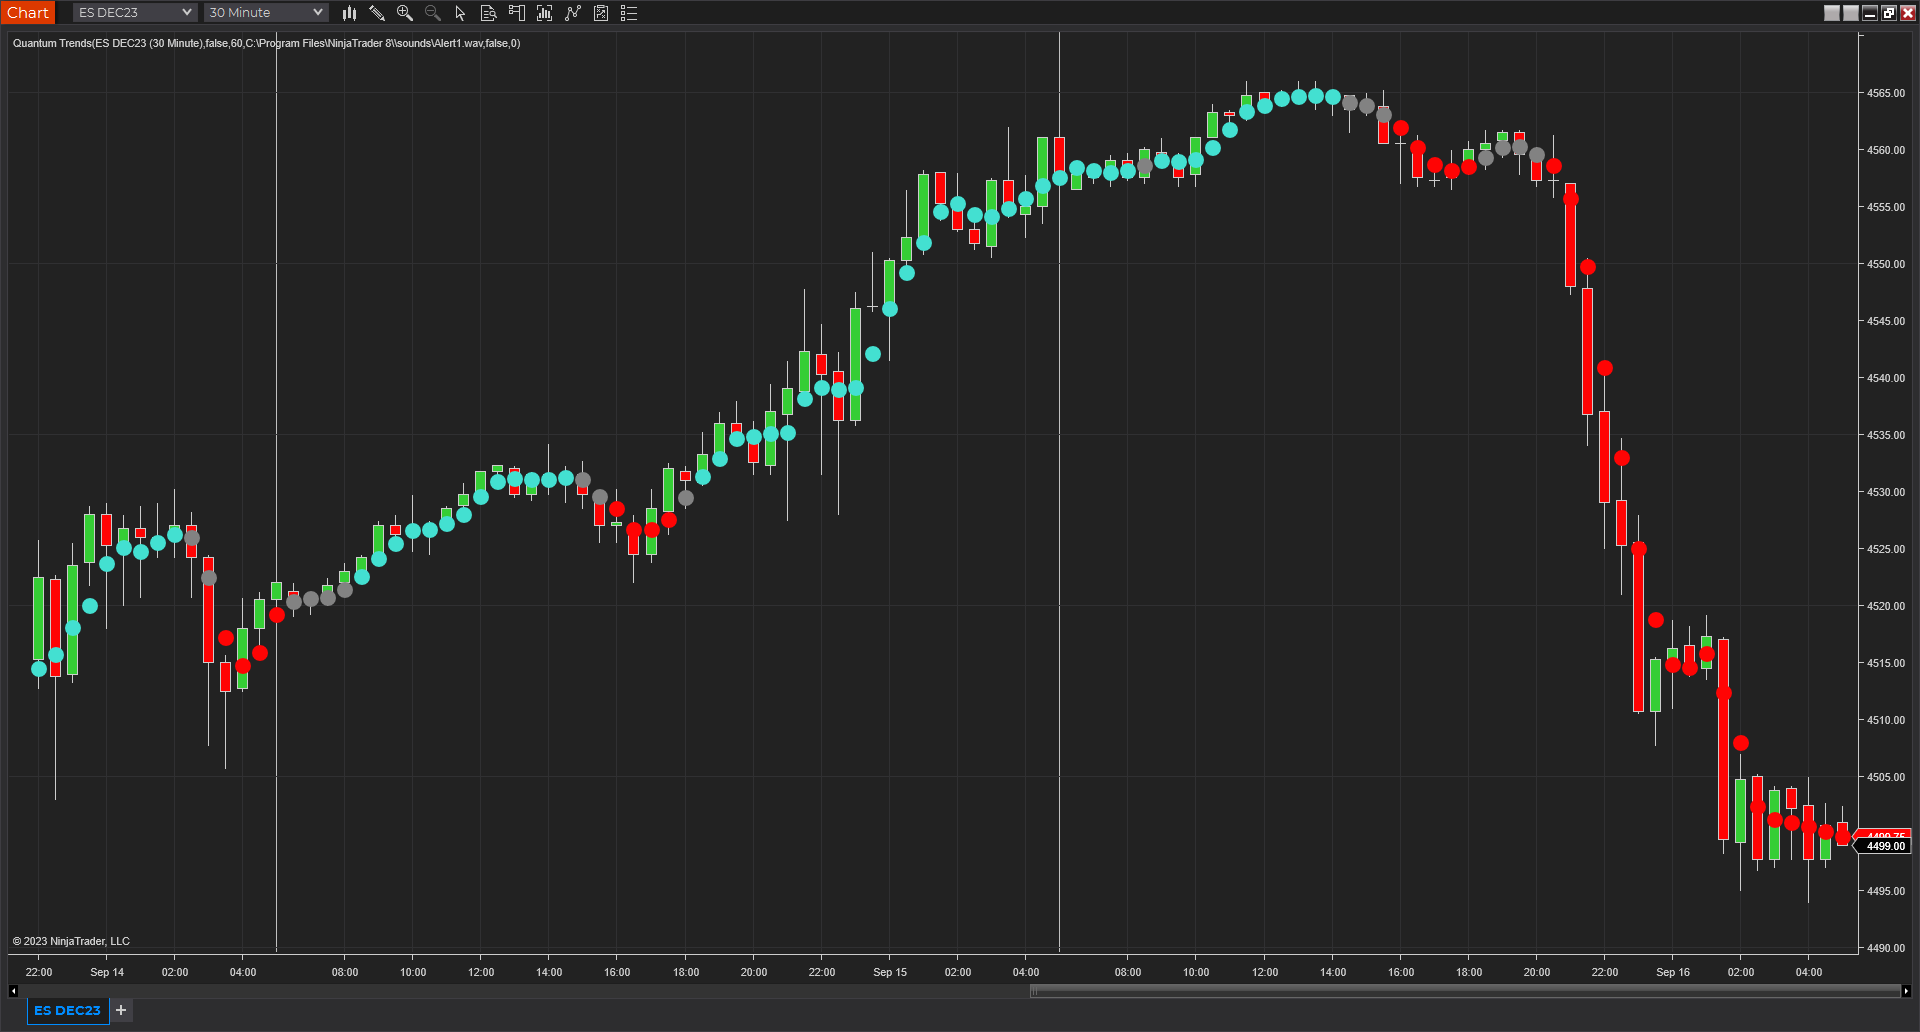
The Quantum Trends indicator is a ‘sister’ indicator to the Quantum Trend Monitor, and work together hand in hand, to keep you in and surfing the trend. This indicator has been designed to be a leading indicator of trend and is therefore extremely sensitive to the minor reversals and pullbacks which occur in all trends. This is where the Trend Monitor becomes so powerful, keeping you in for the longer term. The Trends indicator has also been designed to show you simply and clearly when a trend is potentially starting, ending, or simply moving into a minor congestion phase. All this is achieved with the trend dots, which change color accordingly.
Each dot can be one of 3 signals namely:
- Bullish – the indicator changes into a blue dot (can be changed in the indicator properties) signaling a bullish trend is in effect.
- Bearish – the indicator changes into a red dot (can be changed in the indicator properties) signaling a bearish trend is in effect.
- Congestion – the indicator changes into a grey dot (can be changed in the indicator properties) signaling congestion or pause in the trend.
As with all the Quantum trading indicators, Quantum Trends is best used in multiple timeframes which will give you visual signals to changes in trend, both upstream and downstream of your principal trading chart.
The Quantum Trends indicator works in all timeframes from seconds to minutes and months.
The indicator can be ‘fine-tuned’ to your own preferences in terms of the speed with which the indicator will react to possible changes in trend.
Installation
Open your NinjaTrader 8 platform and select a chart.
Right click the chart to bring up a menu which looks like the following image:
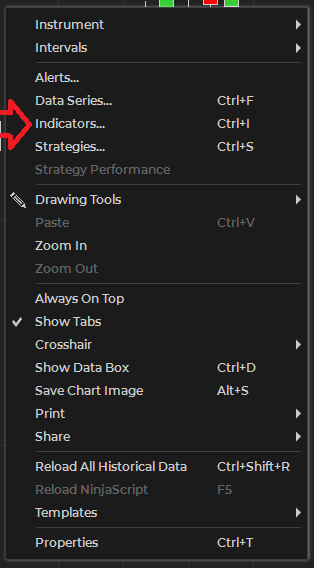
Select Indicators… which will open the following window. Alternatively, you can open this window by clicking the Indicators button in the chart toolbar or by pressing Ctrl + I while focused on the chart.
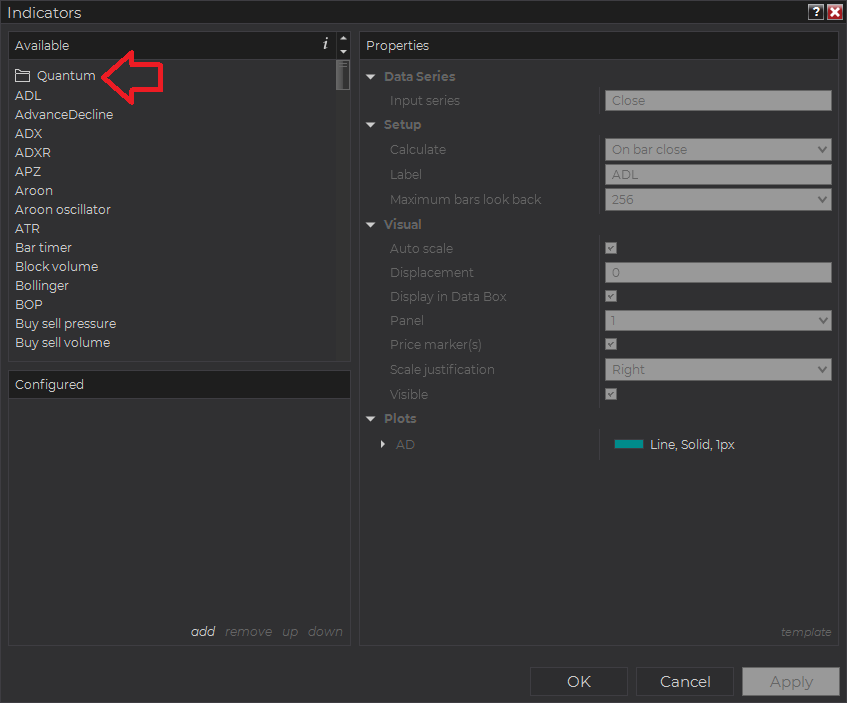
In the Indicators window under Available section, go to Quantum > Quantum Trends and click it to select the indicator. Once selected, click “add” under the Configured section which will put it on the list of active indicators to be added in the chart.
Before clicking the OK or Apply button to complete, the indicator has several configurable options. You can click the Apply button at any time, and this will apply any changes you have made to the indicator without closing the window. This will allow you to see the changes you have made to the indicator, without closing with the OK button or the Cancel button.
Configuration
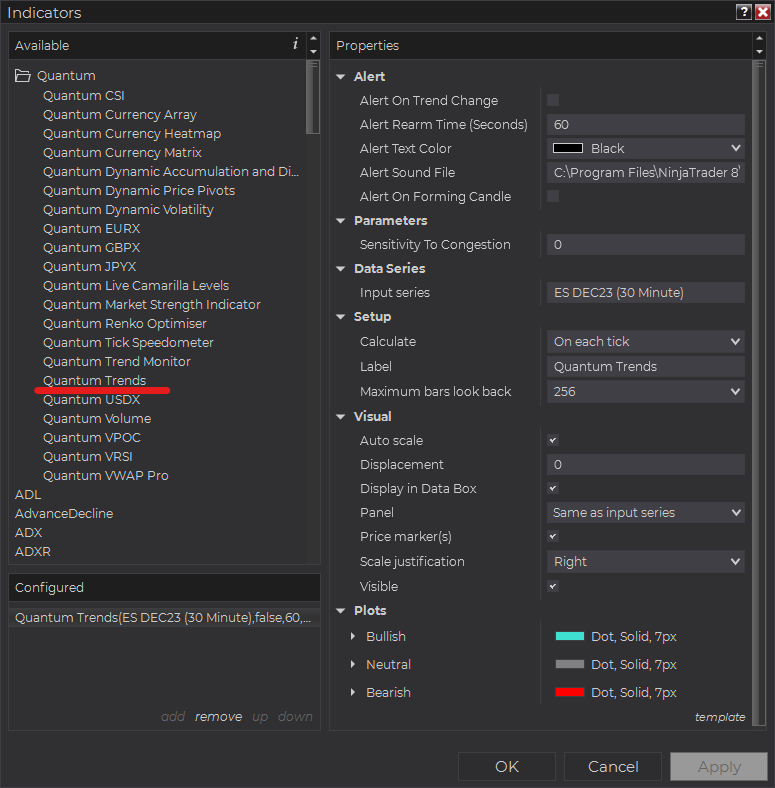
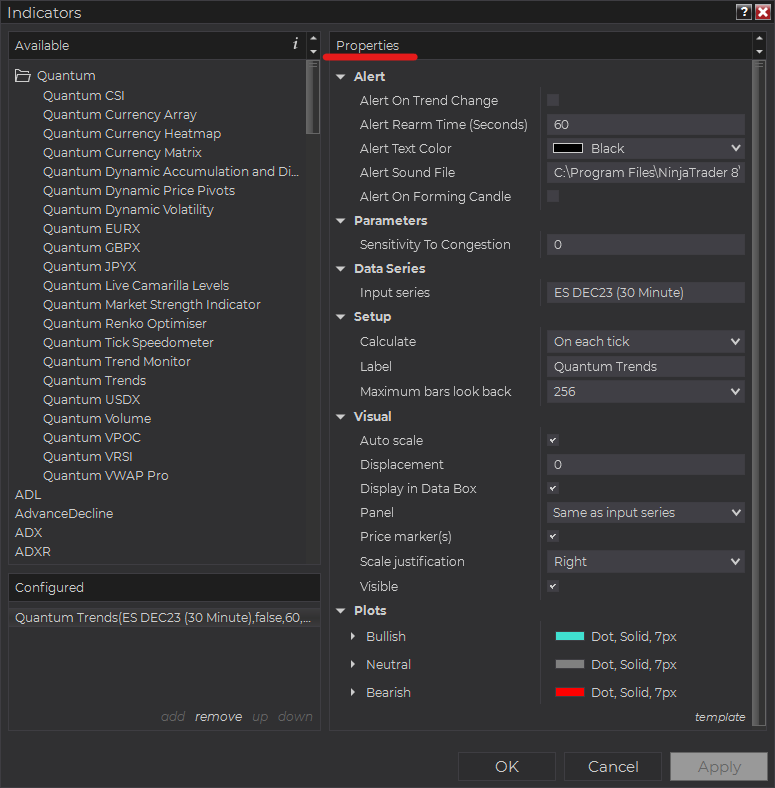
All user input can be configured at the right-hand side of the Indicators window under the Properties section. These are the default settings when you add the indicator in a chart.
Main Settings
Alert
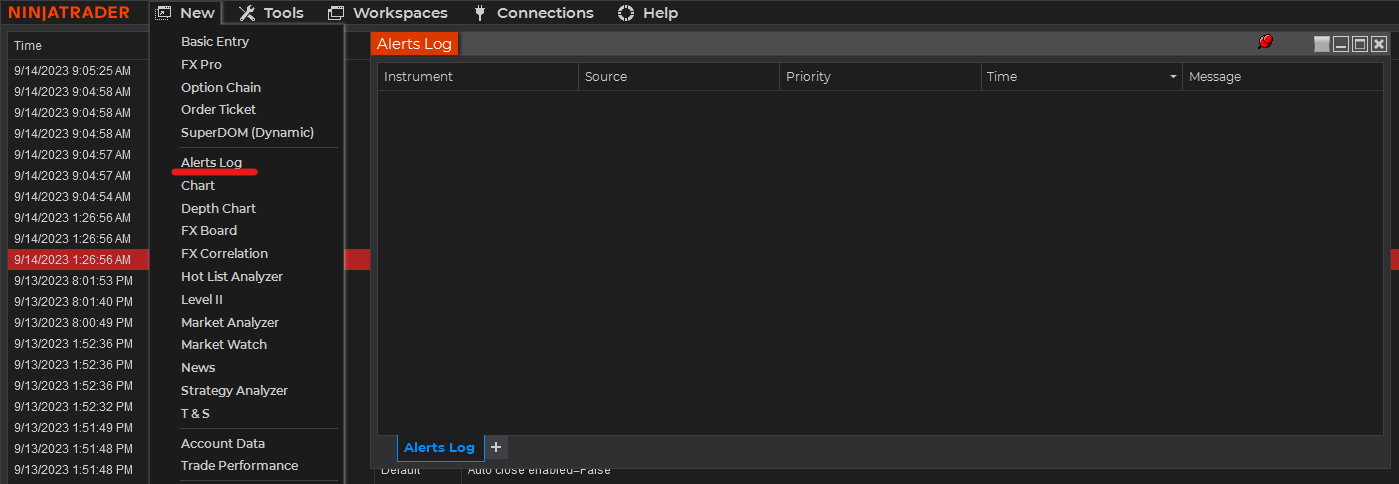
The following settings affect the indicator’s alert notifications displayed in the Alerts Log. You can open the Alerts Log from your NinjaTrader 8 client’s menu bar in the main window at New > Alerts Log. For the Trends indicator, the background color of its messages in the Alerts Log is the same as their respective plot color which can be changed in the Plots section of the indicator properties window.
Alert On Trend Change
When enabled, the indicator sends an alert notification in the Alerts Log when trend sentiment changes which manifests as a change of color in the most current dot.
Alert Rearm Time (Seconds)
This adds a delay to the next alert notification, expressed in number of seconds.
Alert Text Color
This setting allows you to customize the color of the text as the indicator’s messages appear in the Alerts Log.
Alert Sound File
You can change here the sound file the platform uses when this indicator triggers an alert. By default, it uses the Alert1.wav file packaged with your NinjaTrader installation. Please make sure that the file is supported and the absolute path to the sound file is entered correctly.
Alert Current Speed on Forming Candle
When enabled, the alert triggers shift from the most recently closed candlestick to the forming candle.
Parameters
Sensitivity to Congestion
This setting has been provided to allow you to fine-tune the indicator to your own trading style and attitude to risk. Increasing its value makes the indicator more sensitive to detecting congestion phases of price action. This means you will see more of the grey dots which are early signs of potential weakness in the respective trends.
This is a personal choice, and a user input we have included to allow you to have control over the indicator, and whether you want to be alerted earlier to potential weakness or pauses in the trend or are happy to wait before such changes are signaled slightly later, and over shorter periods on the indicator. This is your choice and so can be configured to your own trading style and attitude to risk.
Other Settings
Data Series
Input Series
Opens the indicator Input Series dialogue which allows you to select the source of data for your indicator’s calculations.
Setup
Calculate
Sets the frequency at which the indicator performs its calculations.
Label
The label of the indicator’s instance displayed on the chart.
Maximum bars look back
Determines the maximum number of bars the indicator can look back to perform calculations on historical data. This is set to 256 by default (the most memory-friendly setting), but it can be changed to “infinite” to allow for a greater look back period.
Visual
Auto scale
When enabled, the indicator will be included in the chart panel’s vertical automatic scaling.
Displacement
Sets the number of bars by which to displace the indicator plots.
Display in Data Box
Enables or disables the inclusion of the indicator’s plot values in the Data Box
Panel
Sets the panel in which the indicator is plotted. If you select “Same as input series,” the indicator will be linked to the Input Series and automatically move if the Input Series is modified to a different panel.
Price marker(s)
When enabled, the indicator value is plotted in the axis selected under the “Scale Justification” property.
Scale justification
Sets the scale on which the indicator will be plotted. Possible values are “Right,” “Left,” and “Overlay”.
Visible
Enables or disables visibility and function of the indicator on the chart.
Plots
Sets a variety of parameters, such as color, for the plots drawn by the indicator.
- Bullish
- Neutral
- Bearish
Unloading the indicator
Here are the steps to remove the indicator in the chart and in the Alert Log.
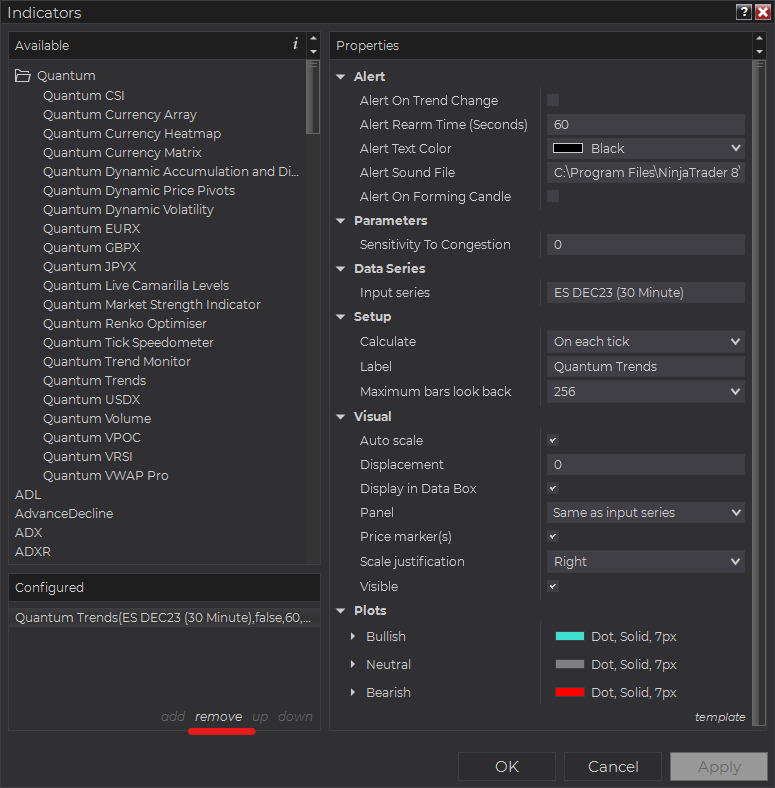
Right-click on the chart then select Indicators… from the menu. Select Quantum Trends from the Configured section and click “remove” then OK to confirm and the indicator should be unloaded from your chart.
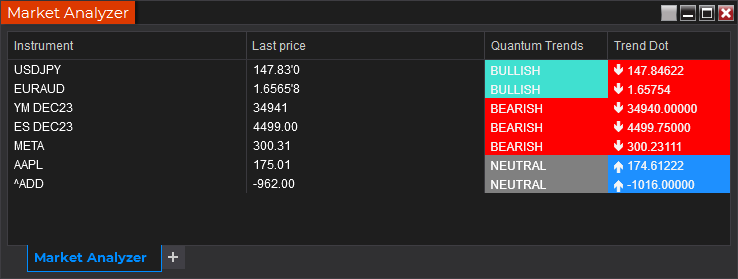
Using the Quantum Trends in the NinjaTrader Market Analyzer
Valid Rows
The Quantum Trends indicator works in any instrument.
Adding the Quantum Trends as a Market Analyzer Column
Here are the basic steps to add the Quantum Trends in the Market Analyzer:
Make sure valid rows are present in the Market Analyzer window.
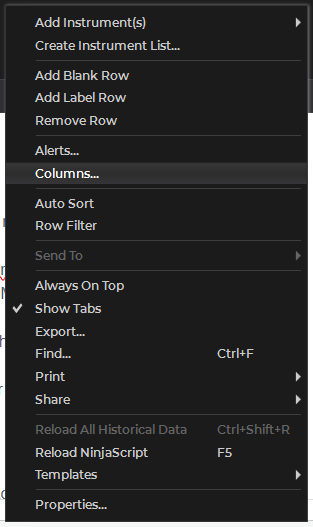
Right-click anywhere in the Market Analyzer window then select “Columns…” in the context menu.
The Columns window appears. In the Available section, go to QuantumMarketAnalyzerColumns folder then double-click the Quantum Trends to add the indicator as one of the columns in the Market Analyzer.
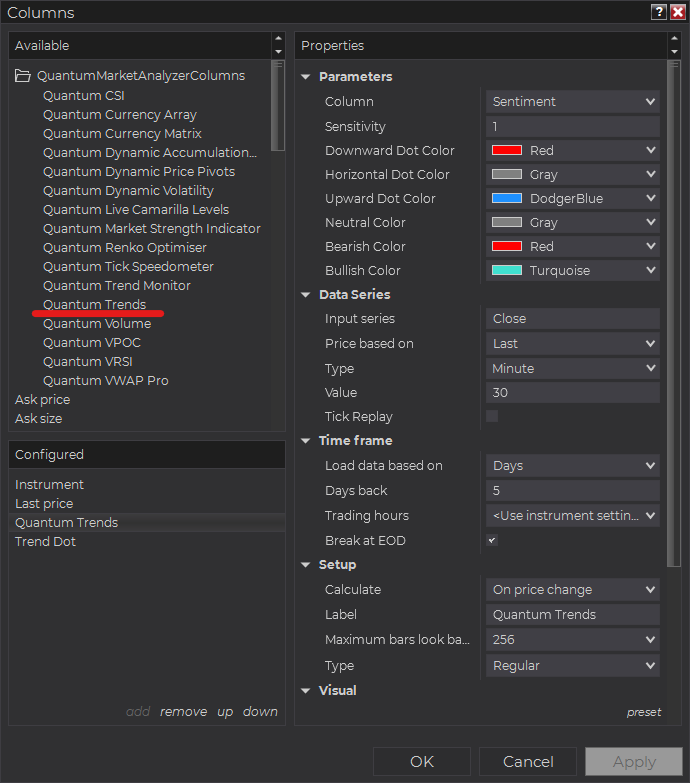
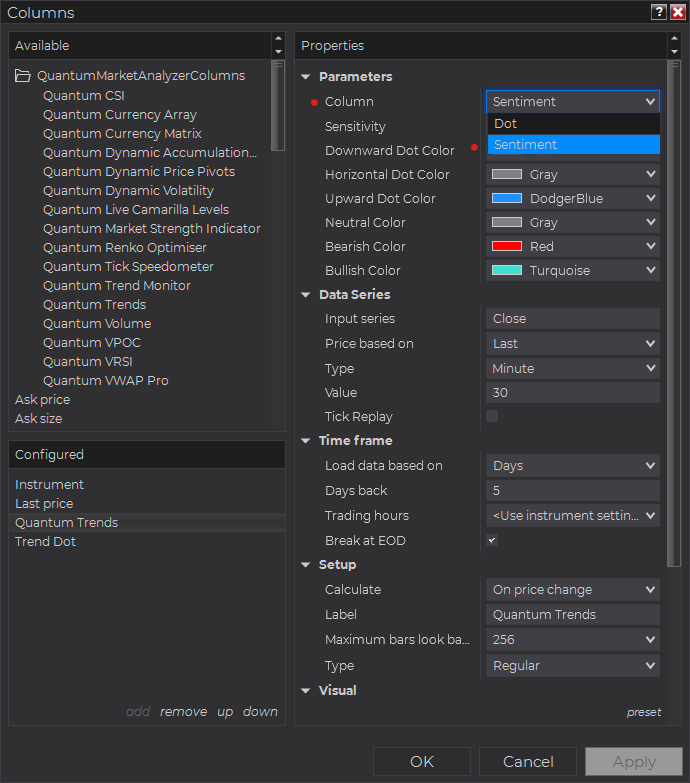
Select the type of information you like to display using the Column drop down menu under the Properties section of the indicator.
Set the timeframe of the indicator in Properties > Data Series section with the following user inputs:
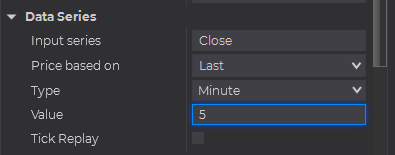
Type – select a time-based series such as Minute or Day
Value – set the interval for the type of series selected above
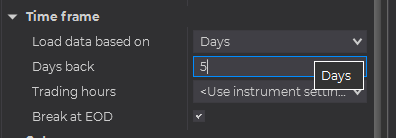
When running the indicator in timeframes less than Hourly intervals, please configure the “Load data based on” property to “Days” and the “Days back” property to the default value of 5 days to ensure that there is enough data for the indicator to work with.
After you have finished all your configurations, click OK to confirm your chosen settings and to add the indicator as a column in your Market Analyzer window.
Column Options
The Quantum Trends is a multi-faceted indicator that can display different types of signals which can be selected through its Column drop down menu found under the Properties section. You can customize the indicator’s function in the Market Analyzer by selecting any of the options enumerated below.
- Dot – displays the direction of the current trend dot (up, down or horizontal).
- Sentiment – displays the current sentiment of the trend.
- Bullish
- Bearish
- Neutral
Tip: You can change the Label property of the column to describe what type of signal you choose to display.


