General – getting started
Every trading strategy, particularly those focused on technical analysis, exploits any combination of the following factors: volume, price, and time. However, not always do you see one that gracefully, or so effectively utilize each to formulate a solid analysis of the next price action. The Quantum Volume Point of Control, or VPOC indicator for NinjaTrader as we like to call it, amalgamates not one, nor two, but ALL THREE of these important aspects of trading in a most logical manner.
The Quantum VPOC indicator for NinjaTrader has taken the analysis of volume and price to a higher level, complementing and expanding the VPA relationship. Whilst the Quantum tick volumes indicator considers the relationship between a single volume bar and its associated candle on the price time x-axis or groups of candles and volume bars, the Quantum VPOC indicator analyses the density and intensity of volume over time against price. In other words, the volume price relationship on the y-axis. It does this in three distinct ways as follows:
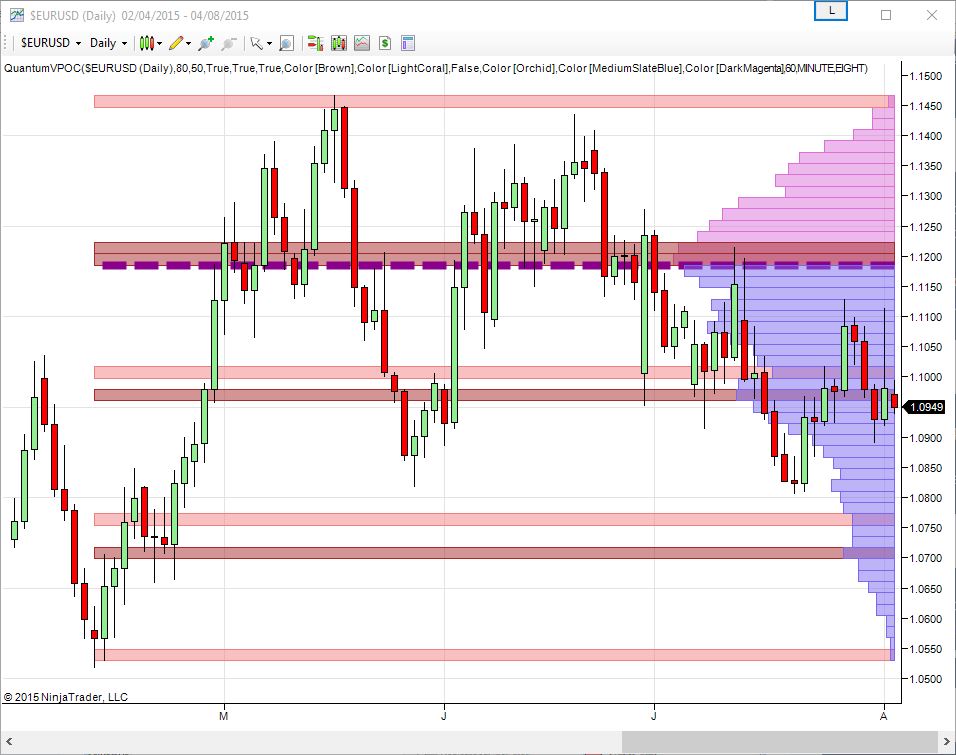
First, the Quantum VPOC indicator constructs the Volume Profile from a set number of bars, from the most distant to the most recent. The Volume Profile is then presented as a vertical histogram shown at the right edge of the chart – a stack of horizontal bars of varying lengths, but of equal height representing the amount of activity at each price level.
Second, the Quantum VPOC analyses the Volume Profile to find the key price levels where activity is strong and rising, or weak and falling. In other words, the indicator looks for peaks (long bars) of the Volume Profile where price tends to be attracted as these are areas where price was previously accepted. These are called High Volume Nodes (HVN). The indicator also looks for troughs or valleys (short bars) of the Volume Profile where price tends to be repelled, as these are areas where price was previously rejected. These are referred to as Low Volume Nodes (LVN). Both types of price level act as precise zones of support and resistance and, as such, are projected across the chart within the given period.
Third, the Quantum VPOC indicator identifies the Highest Volume Node, or the highest peak in the Volume Profile, and marks it as the Volume Point of Control – the price level that acts as the fulcrum from which price pivots. The indicator completes its calculations and updates as each new volume bar is delivered.
The result is a chart revealing the overarching influence of volume at price, coupled with time.
The Quantum VPOC indicator displays several key pieces of information on the chart as follows:
- Volume Profile – this appears as a histogram of volume on the vertical price axis on the right hand side of the chart. The peaks and troughs are clearly displayed highlighting both High and Low Volume nodes.
- High volume node (HVN) – this is where we have a bulge in the volume profile generally as a result of an extended phase of price congestion. As a result, as the market approaches these regions on the chart price action is likely to become waterlogged with further congestion likely with the node acting as a strong area of support or resistance. As we have seen a strong acceptance of price at this level in the past, this is likely to be repeated with the market swinging in a range. Ultimately the market may reverse off these levels, with any move through then confirming the current sentiment.
- Low volume node (LVN) – this is where we see low volume in the volume profile. In these regions, the market has only paused temporarily – in other words a region where price has been rejected in the past. As such we are likely to see the market move quickly through these regions with little in the way of resistance or support acting to prevent a further advance of decline in price. The current sentiment is likely to continue and build quickly through these levels.
- Support and Resistance Zones – these are drawn at the High and Low Volume nodes to highlight the various HVN and LVN levels on the price axis.
- Volume Point of Control Line – this is drawn as a single line on the highest volume of the High Volume Node in the timeframe and clearly defines the tipping point of sentiment. This moves dynamically and represents the fulcrum of market sentiment. If it is above the price action, then the current market sentiment is bearish. If it is below the current price action, then the current market sentiment is bullish. The VPOC Line reveals this balance simply, quickly and clearly allowing you to judge market sentiment with accuracy and confidence.
As with all the Quantum Trading indicators, the VPOC indicator is dynamic, constantly changing and updating to reflect the relentless shift in sentiment as the market moves from bullish to bearish and back again. The indicator works in all timeframes and provides a powerful and much deeper understanding of support and resistance through the prism of volume and the associated High and Low Volume Nodes, with the Point of Control itself, acting as the fulcrum of the market.
Installation
Open your NinjaTrader platform and select a chart
- Right click – this will open the following window:
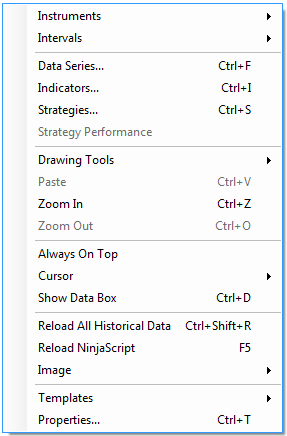
- Left click > Indicators
This will open the following window: (you can also open this window in another way by clicking on the Indicators icon in the NinjaTrader toolbar) 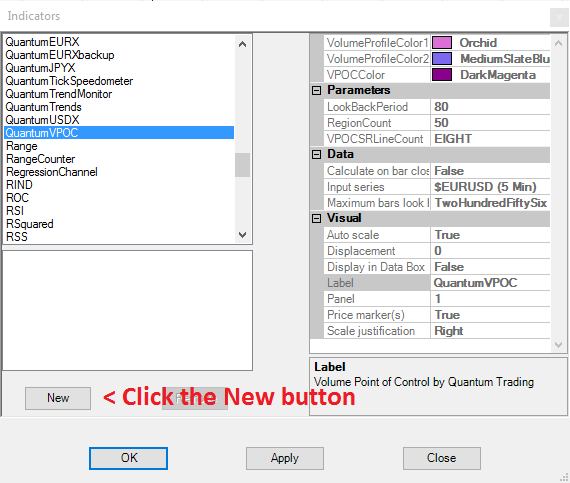
Scroll down to the QuantumVPOC indicator:
- Left click > This will highlight the indicator in blue
- Left click > ‘New’ button as shown above
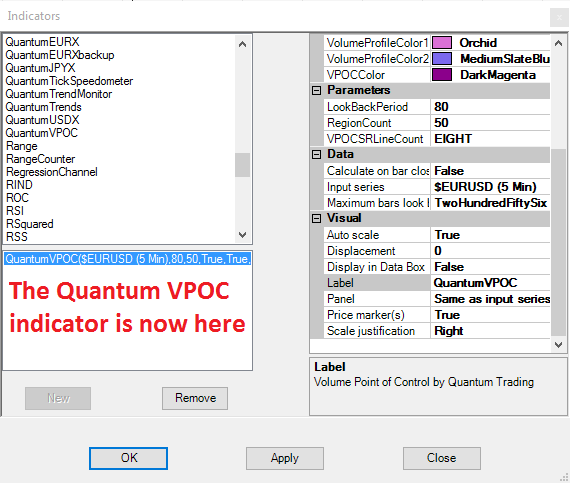
This will add the QuantumVPOC indicator in the box below as shown here:
Before clicking the OK or Apply button to complete, the indicator has one or two options which can be configured. You can click the Apply button at any time, and this will apply any changes you have made to the indicator, without closing the window. This will allow you to see the changes you have made, and to modify again before closing with the OK button, or the Close button. All of the user configuration is done on the right hand side of the above screen, which is shown enlarged below. These are the default settings when you first install the indicator to a chart.
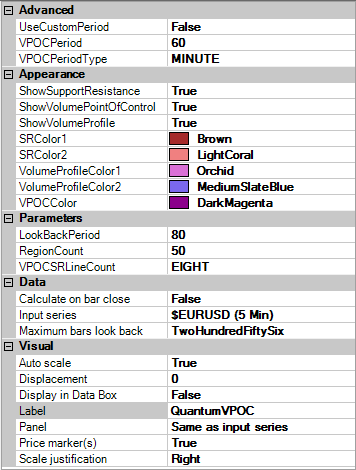
Appearance
The inputs under Appearance control the visibility of the indicator’s elements and their respective colors.
ShowSupportResistance – The support and resistance zones are displayed when this input is set to true, otherwise they are hidden. Its default value is true.
ShowVolumePointOfControl – The VPOC line is displayed when this input is set to true, otherwise it is hidden. Its default value is true.
ShowVolumeProfile – The volume profile is displayed when this input is set to true, otherwise it is hidden. Its default value is true.
SRColor1 – Support and resistance levels can either be High Volume Nodes (HVN) or Low Volume Nodes (LVN). This input sets the color of support and resistance levels that are projected from HVN. Its default value is Brown.
SRColor2 – Support and resistance levels can either be High Volume Nodes (HVN) or Low Volume Nodes (LVN). This input sets the color of support and resistance levels that are projected from LVN. Its default value is LightCoral.
VolumeProfileColor1 – The volume profile is divided into two by the volume point of control. This input sets the color of the top half of the volume profile. Its default value is Orchid.
VolumeProfileColor2 – The volume profile is divided into two by the volume point of control. This input sets the color of the bottom half of the volume profile. Its default value is MediumSlateBlue.
VPOCColor – This input sets the color of the volume point of control (VPOC). Its default value is DarkMagenta.
Parameters
LookBackPeriod – This input determines the scope of the indicator. The objects generated by the indicator such as the support and resistance zones, volume point of control, and the volume profile will cover bars up to the set value of the period parameter. For example, the Period is set to the default value which is 80 bars. The indicator will calculate the volume profile from the 80th bar in the chart to the most current one. The support and resistance zones as well as the volume point of control will only be projected to the 80th bar in history.
RegionCount – The volume profile the indicator generates is composed of several horizontal bars stacked on top of each other of varying lengths. The RegionCount input allows you to refine the definition of the volume profile by increasing or decreasing the profile’s number of bars. Increasing its value will make each bar of the volume profile narrower but increase in number. The support and resistance zones also become narrower but retain its number. Inversely, decreasing its value will make each bar of the volume profile thicker but decrease in number. The support and resistance zones become narrower but retain its number. Its default value is 50 bars.
VPOCSRLineCount – The VPOCSRLineCount parameter allows you to change the number of the support and resistance zones (the orange bars) to a desired or manageable amount. If you double-click the value field, a dropdown menu appears which contains a list of numbers that you can set for the SR zone count:
- TWO
- FOUR
- SIX
- EIGHT
- TEN
- TWELVE
- FOURTEEN
- SIXTEEN
- EIGHTEEN
As you can see, all possible numbers of support and resistance zones are even. This is because zones come in pairs, that is, the first kind of zone projects High Volume Nodes (HVN) and the other projects Low Volume Nodes (LVN). To change the value of this parameter, simply select any one of these predefined numbers from the dropdown menu. Its default value is EIGHT (8) support and resistance zones.
Data
These are the Data inputs:
Calculate on bar close – please DO NOT change this setting and leave as the default of False Input series – this shows the timeframe for the indicator and will be displayed according to the chart time. In this case the indicator was attached to a EURUSD 5min chart
Maximum bars look back – this is the maximum number of bars in the look back for the indicator. We suggest you leave this as the default of TwoHundredFiftySix as it is memory friendly
Visual
These are the Visual inputs:
Auto Scale – DO NOT change this setting and leave this as the default of True
Displacement – DO NOT change this setting and leave this at the default of 0
Display in Data Box – we suggest you leave this at the default of False
Label – this is the label which will display on the chart once the indicator is attached. You can remove this if you wish as follows:
- Place your mouse on the Label label, and left click. This will highlight Label in blue. Left click in the value field alongside and your cursor will appear. Delete the text using the back button and when you apply the indicator, the text will no longer be displayed
Panel – this specifies the panel number where the indicator will appear. We suggest you leave this as the default of Same as Input Series
Price Marker(s) – please DO NOT alter this setting and leave as the default of True Scale
Justification – please DO NOT alter this setting and leave as the default of Right
Removing an indicator
These are the steps to remove an indicator from a chart: Right click on the chart and then left click on Indicators from the pop up menu. Scroll down to the indicator you wish to remove and left click which will turn the indicator blue. This will then display the indicator window with its settings as shown below:
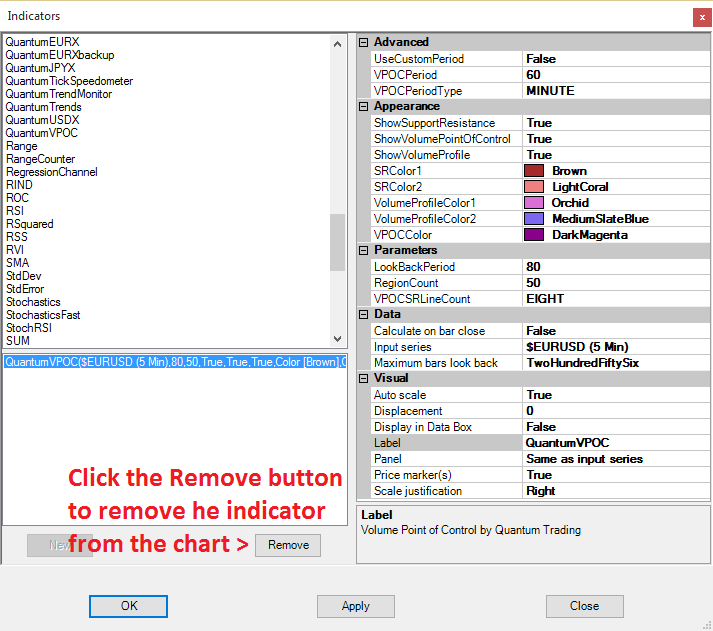 Simply left click on the Remove button as shown above, and the indicator will disappear from the list of indicators on the chart. To confirm left click the OK button to confirm and close the window.


