General – getting started
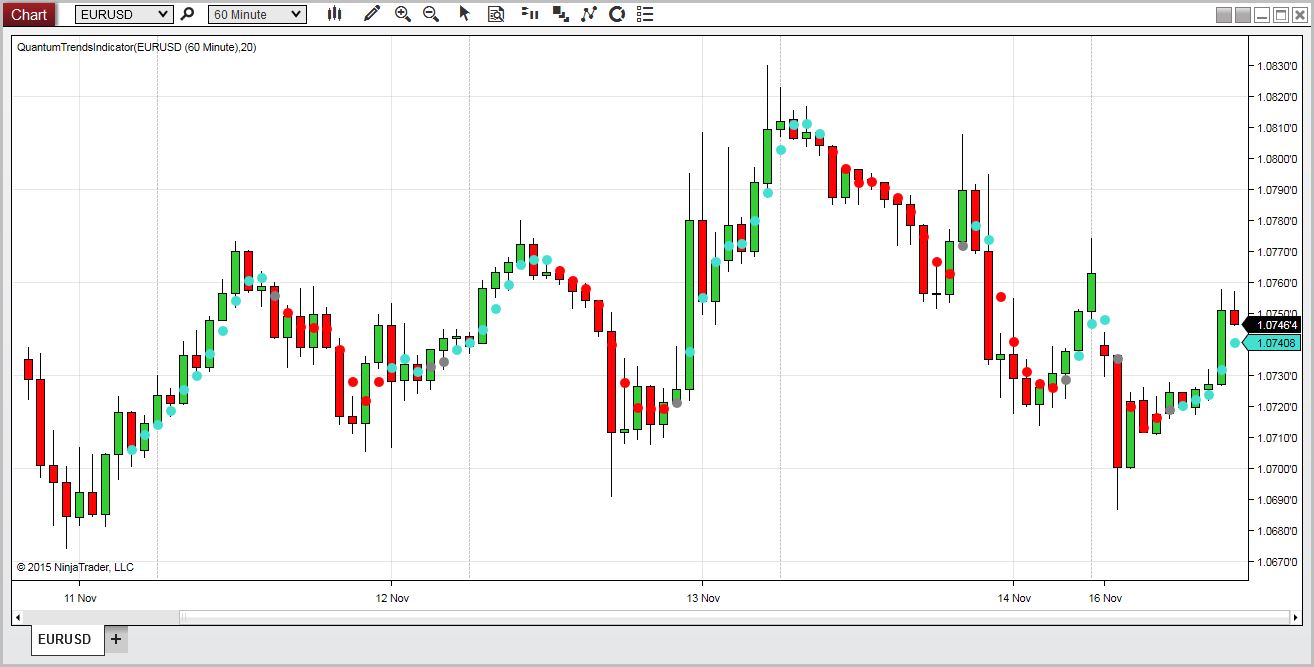
The Quantum Trends indicator is a ‘sister’ indicator to the Quantum Trend Monitor, and work together hand in hand, to keep you in and surfing the trend. This indicator has been designed to be a leading indicator of trend, and is therefore extremely sensitive to the minor reversals and pullbacks which occur in all trends. This is where the TrendMonitor becomes so powerful, keeping you in for the longer term. The Trends indicator has also been designed to show you simply and clearly when a trend is potentially starting, ending, or simply moving into a minor congestion phase. All this is achieved with the trend dots, which change color accordingly.
As with all the Quantum trading indicators, the Quantum Trends is best used in multiple timeframes which will then give you visual signals to changes in trend, both upstream and downstream of your principle trading chart.
- The Quantum Trends indicator works in all timeframes from tick and seconds to minutes and months
- The indicator can be ‘fine tuned’ to your own preferences in terms of the speed with which the indicator will react to possible changes in trend
Installation
Open your NinjaTrader 8 platform and select a chart.
Right click the chart to bring up a menu which looks like the following image:
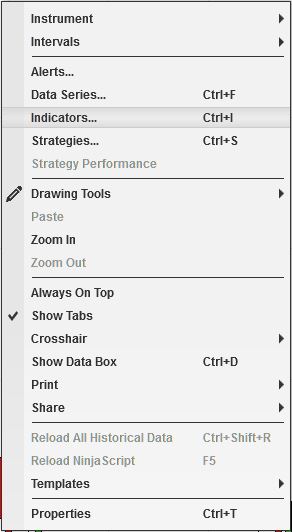
- Select Indicators… which will open the following window. (Alternatively, you can open this window by clicking the Indicators button in the chart toolbar or by pressing Ctrl + I while focused on the chart.)
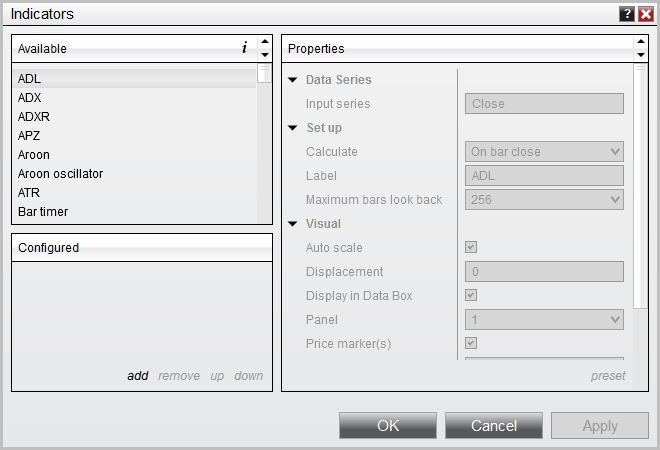
In the Indicators window, scroll down to the QuantumTrends indicator and click it to select the indicator. Once selected, click add in the Configured frame which will put it on the list of active indicators to be added in the chart.
Before clicking the OK or Apply button to complete, the indicator has a number of options which can be configured. You can click the Apply button at any time, and this will apply any changes you have made to the indicator without closing the window. This will allow you to see the changes you have made to the indicator, without closing with the OK button or the Cancel button.
Configuration
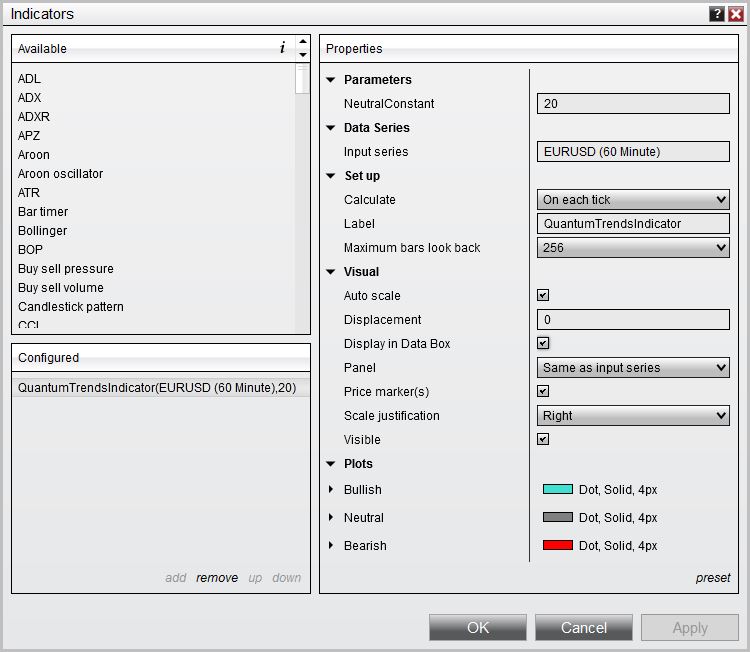
All of the user configuration is down on the right hand side of the Indicator window. These are the default setting when you first install the indicator to a chart.
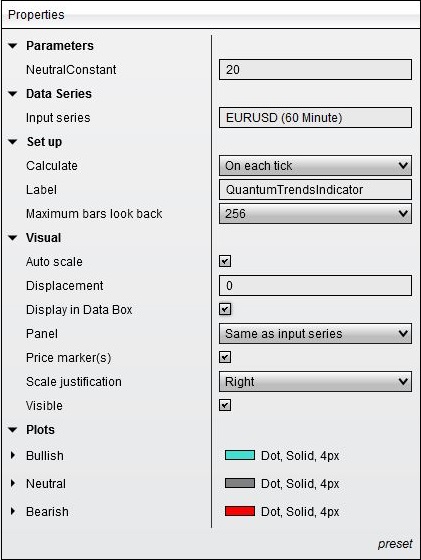
Parameters
NeutralConstant – this parameter gives you full control over the sensitivity of the Trends indicator, by allowing you to fine tune the indicator to your own trading style and preferences. Increasing this parameter makes the indicator more sensitive to determining weak trends hence the transitional trend dots will expand, while reducing the value will also reduce these regions making transitions appear more quickly. This is a personal choice and as always in trading it is a question of assessing risk – the risk of getting in too early or too late, and also the risk of getting out too early or staying in too long. From our experience we have found that a value of 20 is a good starting point, and this value can then be adjusted to suit your trading style accordingly. Any number above 20 will increase the periods of congestions when the grey trend dots will be more numerous, whilst any number below 20 will reduce them accordingly.
Data Series
Input series – this shows the timeframe for the indicator and will be displayed according to the chart time.
Set up
Calculate – please DO NOT change this setting and leave as the default of On each tick
Label – this is the label which will display on the chart once the indicator is attached. There is no need to change the value of this configuration.
Maximum bars look back – this is the maximum number of bars in the look back for the indicator. We suggest you leave this as the default of 256 as it is memory friendly
Visual
Auto Scale – DO NOT change this setting and leave this as the default of True (checked)
Displacement – DO NOT change this setting and leave this at the default of 0
Display in Data Box – we suggest you leave this at the default of True (checked)
Panel – this specifies the panel number where the indicator will appear. We suggest you leave this as the default of Same as input series
Price Marker(s) – please DO NOT alter this setting and leave as the default of True (checked)
Scale Justification – please DO NOT alter this setting and leave as the default of Right
Visible – this shows or hides the plots of the indicator. Please leave it checked to make the indicator visible.
Plots
This is where you can change various properties of the indicator’s plots:
- Bullish – indicates a bullish price action
- Neutral – indicators congestion in price action
- Bearish – indicators a bearish price action
A list of plot styles or properties will be shown to you by clicking the arrow graphic beside the plot for you to customize the appearance of the plot to your liking:
- Color – the default color of Bullish plot is Turquoise, the default color of Neutral plot is Gray, and the default color of Bearish plot is Red
- Dash style – default is Solid, but changing this property does not affect the appearance of the plots
- Plot style – default is Dot for all plots
- Width – default is 4
Once you have made any changes to the settings for the Trends indicator, left click the OK button to complete and update the indicator.
Removing an indicator
These are the steps to remove an indicator from a chart.
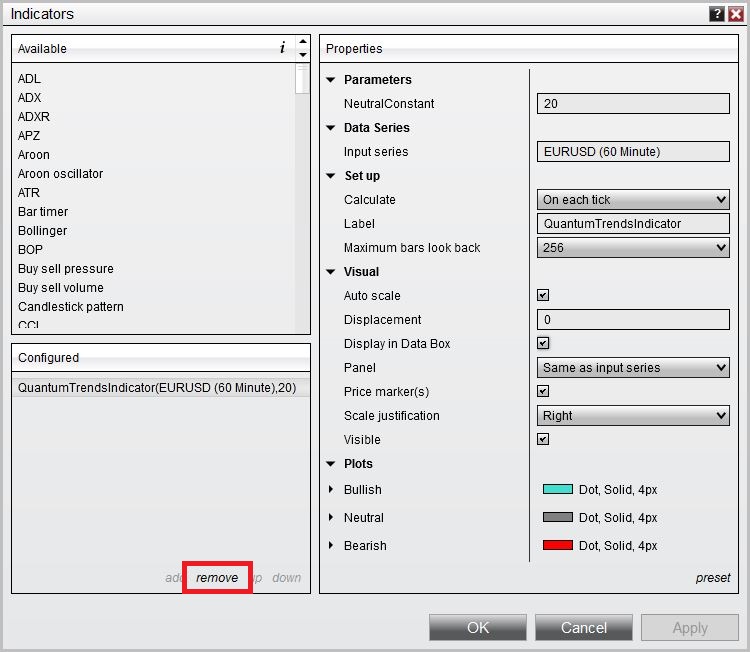
Right click on the chart then select Indicators from the menu. Select QuantumTrendsIndicator from the Configured frame and click remove. Click OK to confirm and the indicator should be unloaded from your chart.


