General – getting started
For ships at sea, the lighthouse flashing its constant signals is a warning of one thing – danger ahead. The Quantum Dynamic Volatility indicator for NinjaTrader 8 is the traders lighthouse. It is warning of possible danger ahead, signalling extreme volatility in the market, and potential hazards for the unwary trader.
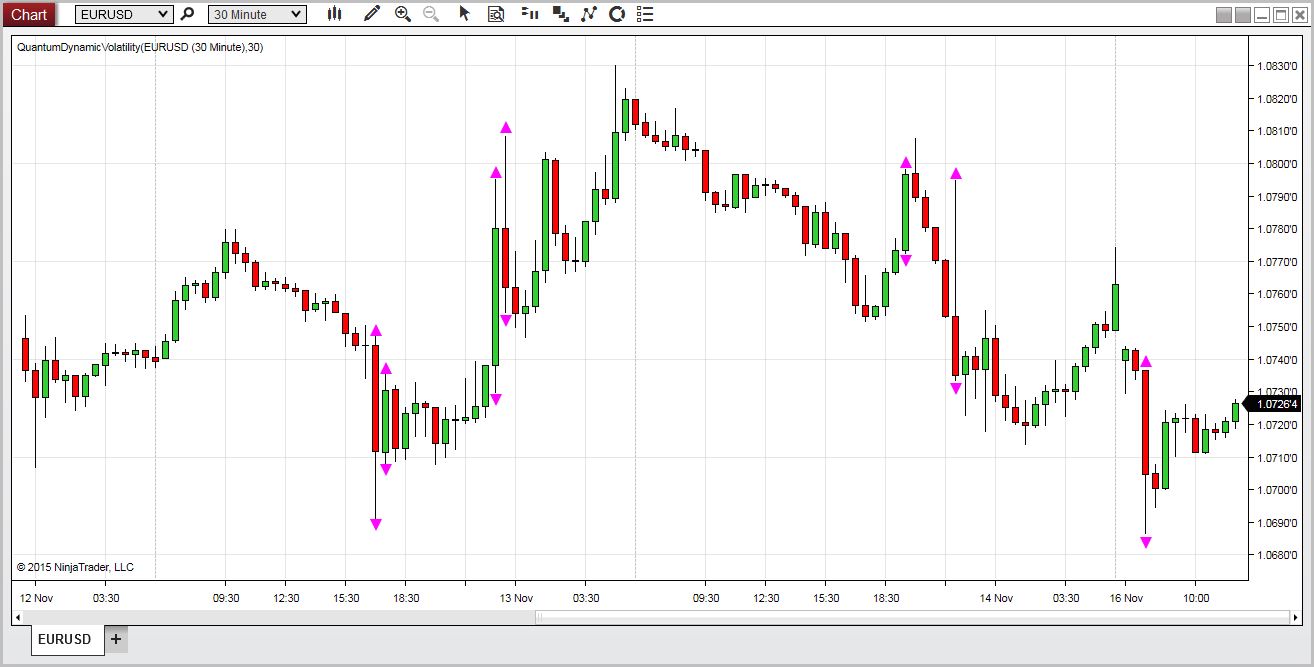
The trading indicator signals this volatility, using average true range. It is constantly scanning the price action for extremes, and when they arrive, are signalled on the chart with a purple arrow, above and below the candle or bar. This is a warning signal to stay out. What often happens following these periods of volatility is that the price action then retraces and trades within the spread of the candle or bar. The reason for this is easy to understand. The market has moved sharply higher or lower on a news release. Excited traders then jump into the move, hoping for some easy money. The market makers then reverse the price action, leaving these traders trapped in weak positions.
This happens repeatedly and is the reason that the we developed the indicator. To signal these volatile bars and candles in realtime, and the associated warning to take care. Generally, once the signal is triggered, you will find the market moving back into the range of the bar or candle, before breaking higher or lower in due course. Once the price action has been validated by a clear move away and a close above or below, then it is safe to consider taking a position in the market once again.
The Quantum Dynamic Volatility indicator for NinjaTrader 8 is sending a clear warning. It’s warning of high risk, and telling you to take care. The indicator paints two arrows, one above and one below the candle or bar.
The Quantum Dynamic Volatility indicator works in all timeframes from seconds and ticks to minutes and months.
Installation
Open your NinjaTrader 8 platform and select a chart.
Right click the chart to bring up a menu which looks like the following image:
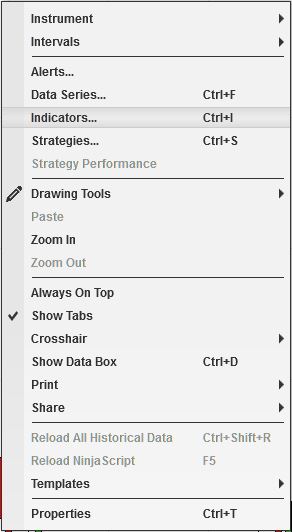
Select Indicators… which will open the following window. (Alternatively, you can open this window by clicking the Indicators button in the chart toolbar or by pressing Ctrl + I while focused on the chart.)
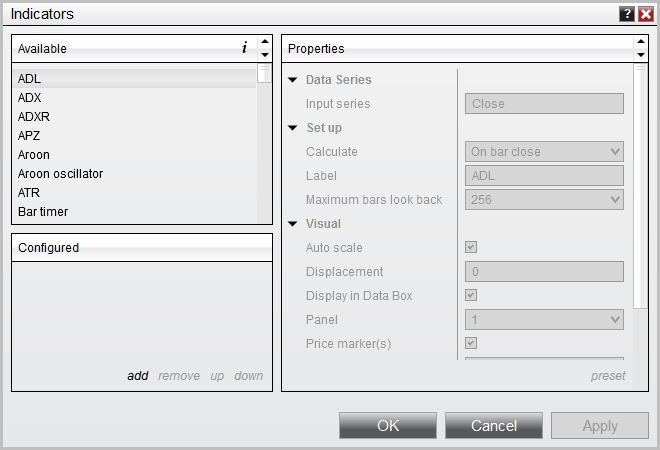
In the Indicators window, scroll down to the QuantumDynamicVolatility indicator and click it to select the indicator. Once selected, click add in the Configured frame which will put it on the list of active indicators to be added in the chart.
Before clicking the OK or Apply button to complete, the indicator has a number of options which can be configured. You can click the Apply button at any time, and this will apply any changes you have made to the indicator without closing the window. This will allow you to see the changes you have made to the indicator, without closing with the OK button or the Cancel button.
Configuration
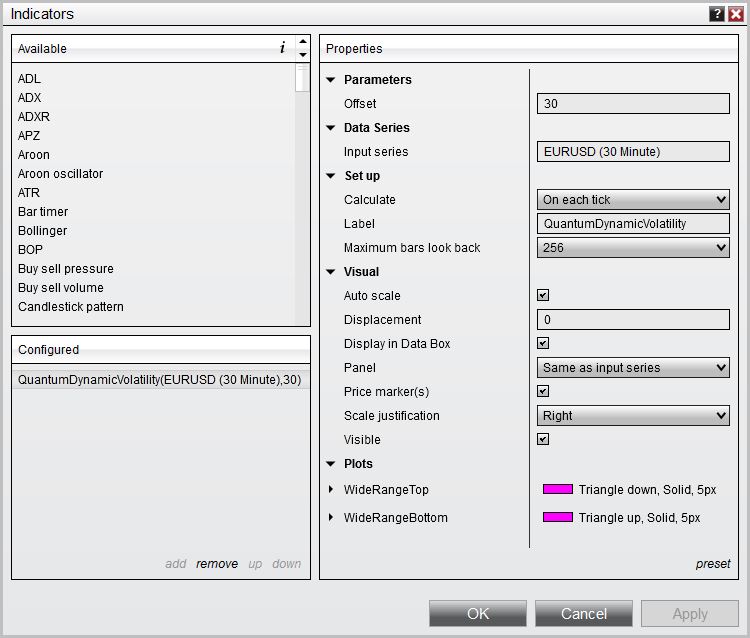
All of the user configuration is down on the right hand side of the Indicators window. These are the default setting when you first install the indicator to a chart.
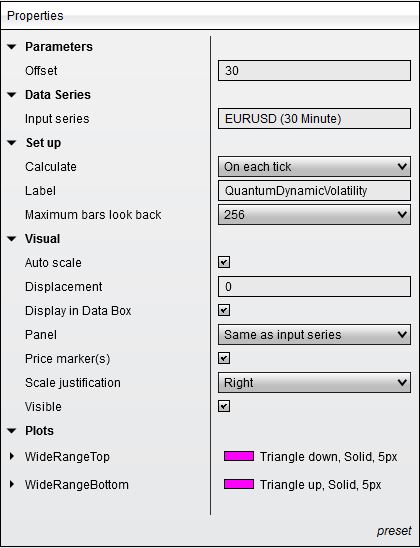
Parameters
Offset – this adjusts the vertical distance of the purple triangle from the candle of bar. The default is 30 but you can change this to suit your own personal preference. A higher number will move it further way, whilst a lower number will move it closer.
Sensitivity – This is set to 0 by default but by increasing the value of this setting, the indicator becomes more sensitive to identifying bars that exhibit volatility.
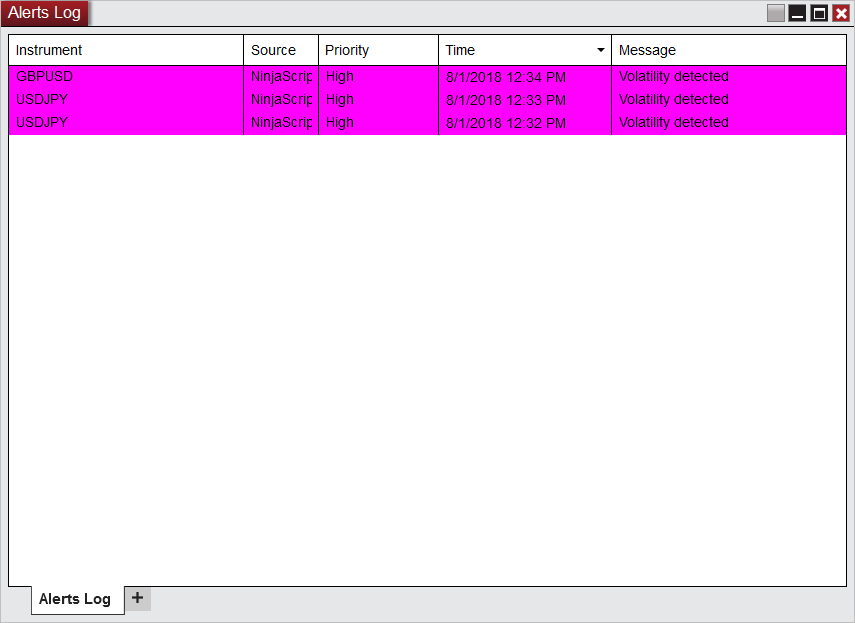
EnableAlerts – When ticked, the indicator lets you know when a volatility signal is detected and displays it in the NinjaTrader Alerts window.
Data Series
Input series – this shows the timeframe for the indicator and will be displayed according to the chart time.
Set up
Calculate – please DO NOT change this setting and leave as the default of On each tick
Label – there is no need to change the value of this configuration
Maximum bars look back – this is the maximum number of bars in the look back for the indicator. We suggest you leave this as the default of 256 as it is memory friendly
Visual
Auto Scale – DO NOT change this setting and leave this as the default of True (checked)
Displacement – DO NOT change this setting and leave this at the default of 0
Display in Data Box – we suggest you leave this at the default of True (checked)
Panel – this specifies the panel number where the indicator will appear. We suggest you leave this as the default of ‘Same as input series’
Price Marker(s) – please DO NOT alter this setting and leave as the default of True (checked)
Scale Justification – please DO NOT alter this setting and leave as the default of Right
Plots
This is where you can change various properties of the indicator’s plots:
- WideRangeTop
- WideRangeBottom
Both plots mark a candle with high volatility and does not differ in significance with one another.
A list of plot styles is shown to you by clicking the arrow graphic beside the plot for you to customize the appearance of the plot to your liking:
- Color – default is Magenta
- Dash style – default is Solid, but changing this property does not affect the appearance of the plot
- Plot style – default is Triangle Up for WideRangeTop and Triangle Down for WideRangeBottom
- Width – default is 5
Once you have made any changes to the settings for the Dynamic Volatility indicator, left click the OK button to complete and update the indicator.
Removing an indicator
These are the steps to remove an indicator from a chart.
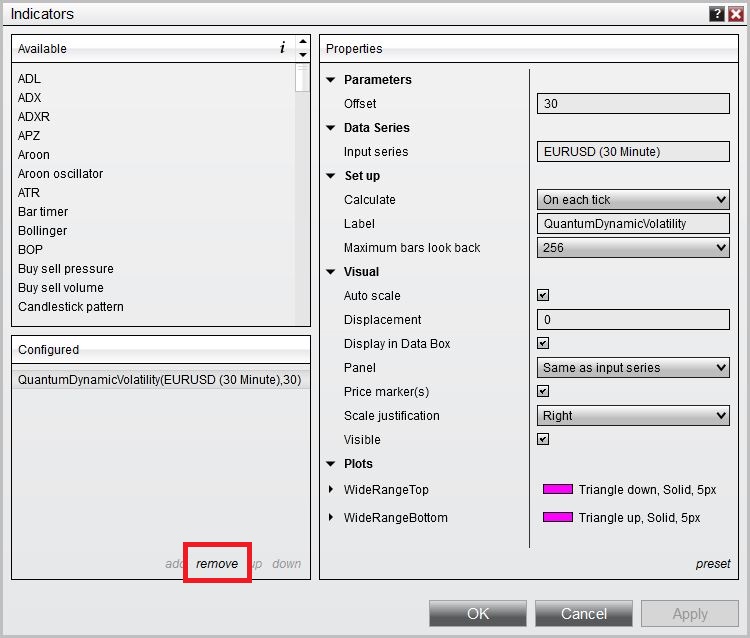
Right click on the chart then select Indicators… from the menu. Select QuantumDynamicVolatility from the Configured frame and click remove. Click OK to confirm and the indicator should be unloaded from your chart.


