

Description
We all understand the concept of time. A five-minute chart will build a bar or candle every five minutes throughout the day. But time is an artificial measurement, something the market neither knows nor cares about. It moves at its own speed, varying constantly throughout the session. Isn’t it odd then to think that most traders use a time-based chart, which has no relevance or relationship to the market in any way whatsoever? Something the professional traders have always recognized.
But what is a tick chart? Let me explain.
If you’ve ever seen a sailing yacht at sea, or even sailed one yourself, then you will be aware of how, the wind, the tide and the sea conditions are constantly shifting and changing. And as they do, so the person steering the boat has to make changes too. Perhaps a slight alteration in the course, perhaps moving the boat closer into the wind or away from the wind as it shifts and changes constantly. The boat is constantly ‘trimmed’ so that it sails perfectly in the current conditions, which may change a few minutes later. And the point is this – you wouldn’t sail a yacht in the same direction with the same sail settings in all conditions. The sails and course are set according to the prevailing conditions. If the sea is calm with very little wind or tide, then sails are set to maximize the wind available with further sails added. As wind speed increases, or the tide changes, then the number of sails may be reduced, and any changes in wind direction matched with minor changes in course.
This is what a tick chart. It describes the sea state of the market. The constant ebb and flow, the precise sentiment tick bar by tick bar, something a time-based chart will never reveal. Each tick bar is independent of time, building at the speed that the market is moving, at that time. As a result, each tick bar on a chart is built at a different speed, showing you instantly changes in sentiment, momentum, and volatility. No longer are you viewing a time chart with only one speed – now you are viewing a chart that has multiple speeds matched to market conditions. The market is truly revealed putting you in tune with the market. As the market speeds up, so you will be able to jump in and take advantage of volatile price action. As the market slows down, you may become more cautious, and wait, or perhaps exit an existing position. This is what tick trading is all about. Matching your trading to the precise market conditions and trading accordingly.
Specifically, a tick chart gives you five major advantages:
- Tick charts allow you to see momentum changes and the associated volume changes – as they happen. You are trading with the professionals, tick by tick, and not delayed by time. Precision intraday trading on the ES E-mini for example requires a precision tool. The tick chart is just that!
- Tick charts allow you to fade the amateurs. Low volume activity on tick charts will reveal where the amateurs are buying or selling.
- Tick charts allow you to jump on breakouts fast. A time-based chart will take minutes to close. A tick-based chart will get you in early and out early too.
- Tick charts reveal changes in market sentiment very fast, which you never see on a time-based chart. If the tick speed is falling, then momentum is draining away. If the tick speed is rising, momentum is building.
- Tick charts give you much clearer and more precise entry and exit signals using three criteria – price, volume, and momentum. Time-based charts only offer two – price and volume.
So, some powerful reasons to use tick charts in your trading. And at this stage, you might be asking some questions such as…..
- How do I know what tick speed to use for a particular instrument
- How do I know when the tick speed has changed during the session
- How do I convert a time-based chart to a tick-based chart
All great questions and indeed ones you will find asked in trading forums around the world. Many traders simply guess at a tick speed or ask their fellow traders for advice. Others suggest ‘magic’ numbers that have some mystical quality, and which are then passed on from one trader to another! Worse still, the same tick chart is then applied for the entire trading session in the same way as a time-based chart, making the entire approach worthless.
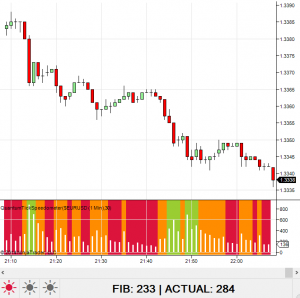
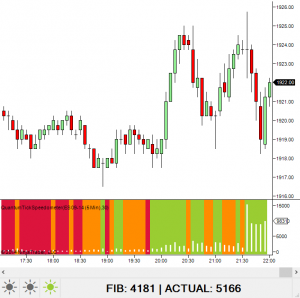
The Quantum TickSpeedometer answers all these questions and more, putting the power of tick chart trading at your fingertips. You will be amazed and shocked at the variation in tick speeds from one market and instrument to another, which is why it is so powerful. As an example, the average tick speed for gold on a 5 minute chart might be a few hundred ticks, on the ES E-mini, this could be a few thousand.
So how does it work?
First, the indicator is dynamic. This is not a static indicator that only displays data based on history. It is dynamic, counting and displaying tick activity in real time as the market moves tick by tick and minute by minute.
Second, the indicator acts as the bridge between time and tick. Apply the indicator to a time-based chart and it will display the current tick speed for that instrument, at that precise moment in the session. It’s a time tick converter if you like. So for example, if you are an index trader and prefer the 1-minute chart, apply the indicator and this will then display the equivalent tick speed for the index dynamically. This will change throughout the trading session allowing you to see the momentum changes as tick speeds increase or decrease accordingly
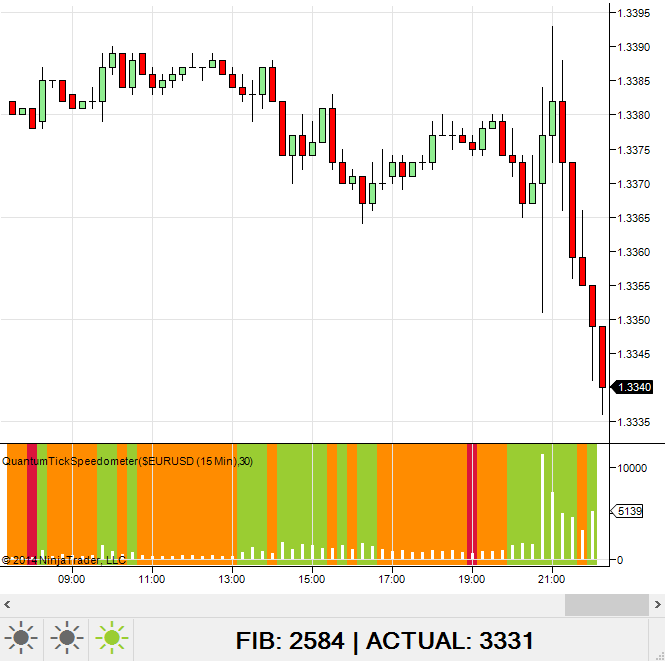
Third, the indicator displays both the actual and the closest Fib number. This gives you the option to trade using the actual tick speed, or the closest Fibonacci number to the actual. The Fibonacci number will change less often requiring fewer changes to the tick chart setting, whilst the true number will change more frequently. It’s your choice.
Fourth, the indicator includes a traffic light system which gives a visual signal of whether the tick speed for that timeframe is speeding up or slowing down. When the red traffic light is displayed it’s a strong signal of low volatility, and a warning signal of possible danger ahead as the price action moves into congestion.
Fifth and last, the indicator displays the levels of tick activity graphically, showing those areas of high medium, and low volatility.
The indicator works in all timeframes and with all instruments and markets. So whether you are a scalping trader on the ES E-mini or other indices, or perhaps a swing trader of commodities, stocks, or bonds, the indicator will deliver all the tick information you need to start trading with the professionals.
Finally, one other question you may be asking is how to use this indicator creatively – a great question. There are several ways. First, the indicator can simply be used to give you precise information on which tick speed to set using the equivalent time-based chart. If you like to trade gold intraday using a 10-minute chart, simply select the GC futures contract on the chart, select the 10-minute timeframe and apply the indicator. This will then instantly display the current dynamic tick speed for trading gold futures along with all the other information as outlined above.
Next, using the indicator with multiple charts is another great way to trade using tick charts. Simply choose the three timeframes, perhaps 1min, 5 min, and 15 min, apply the indicator to all three, and you then have the dynamic tick data for trading using three tick charts. Combine this approach with some of the other Quantum Trading indicators, and you then have an excellent platform, trading the three tick speeds, with the slow being your dominant, the middle being your trading chart, and the fast being your heads up on changes in trend.
Finally, if you use volume price analysis, using a combination of time and tick-based charts gives you the opportunity to apply this analytical technique from the time-based charts, yet trade-off the tick chart equivalent. This is a powerful approach, as it combines the VPA methodology with the speed and precision of tick trading – a winning combination. So for example you may have a 5 minute time chart showing the volumes, with the equivalent tick chart equivalent alongside. You can then analyze the time chart using VPA techniques while trading using the power of tick.
The Quantum Tickspeedometer finally puts the power of tick trading within your grasp. No more guesswork, no more asking other traders – soon they will be asking you! The Quantum Tickspeedometer is easy to install and configure, then presents all the tick data for you simply and graphically. All you have to do is start trading and join the professionals today.