Introduction
The Market Strength Indicator (MSI) is yet another in our stable of volume-based indicators, and as such, is a must-have tool for trading virtually any type of market and across a myriad of applications from trend trading to swing trading, scalping, and much more. While its sister indicator, the Currency Strength Indicator (CSI), helps you analyze which currencies are oversold, overbought, correlating, and trending, the MSI does this also, but in this case, for all markets, including stocks, ETFs, futures, and cryptocurrencies, but with one key difference – VOLUME.
As with our core methodology of volume price analysis, volume adds an entirely new dimension to trading analysis as it reveals the driving pressure behind the price action, be it strong or weak, which are all factored into the algorithm that drives the Market Strength Indicator. But with the MSI indicator, its use and application is only limited by your imagination.
For example, we can use it to see which markets are correlating and which are not so that we might use it as an intraday tool for index futures. And, of course, with knowledge gained from the stock trading and investing program, we could then further validate any analysis by setting each against the top five market cap stocks, for confirmation of strength and to give us more confidence in trading an index future.
And not just index futures, but any futures you care to consider, such as energy, metals, softs, currencies or anything else.
For day traders of stocks, you might wish to see which are correlating with one another and which are not, for example, if you are pairs trading, and also whether a particular stock is moving with the primary futures index. If not, this may be a warning sign. And of course, for ETF traders, we have the SPY, a host of ETFs, and alongside them, the sectors, such as the XLK, the XLE, and more, giving you an instant and powerful insight into sentiment across the entire market complex.
The Market Strength Indicator has much to offer; whether you are a stock investor or day trading scalper, index or ETF trader, swing trader or trend trader, it is all here as the indicator signals in a clear and intuitive way when a stock, future or ETF is overbought or oversold in all timeframes, giving you that potent insight into potential reversals from strong to weak and back again. If you enjoy getting into a trend early and trading reversals, then this is the indicator for you, but if you prefer trading trends – no problem, just jump aboard once the move has some momentum and is underway as displayed by the steepness of the line on the indicator.
It’s all here and so much more, from market correlations to market strength and weakness and in all the timeframes from seconds to months.
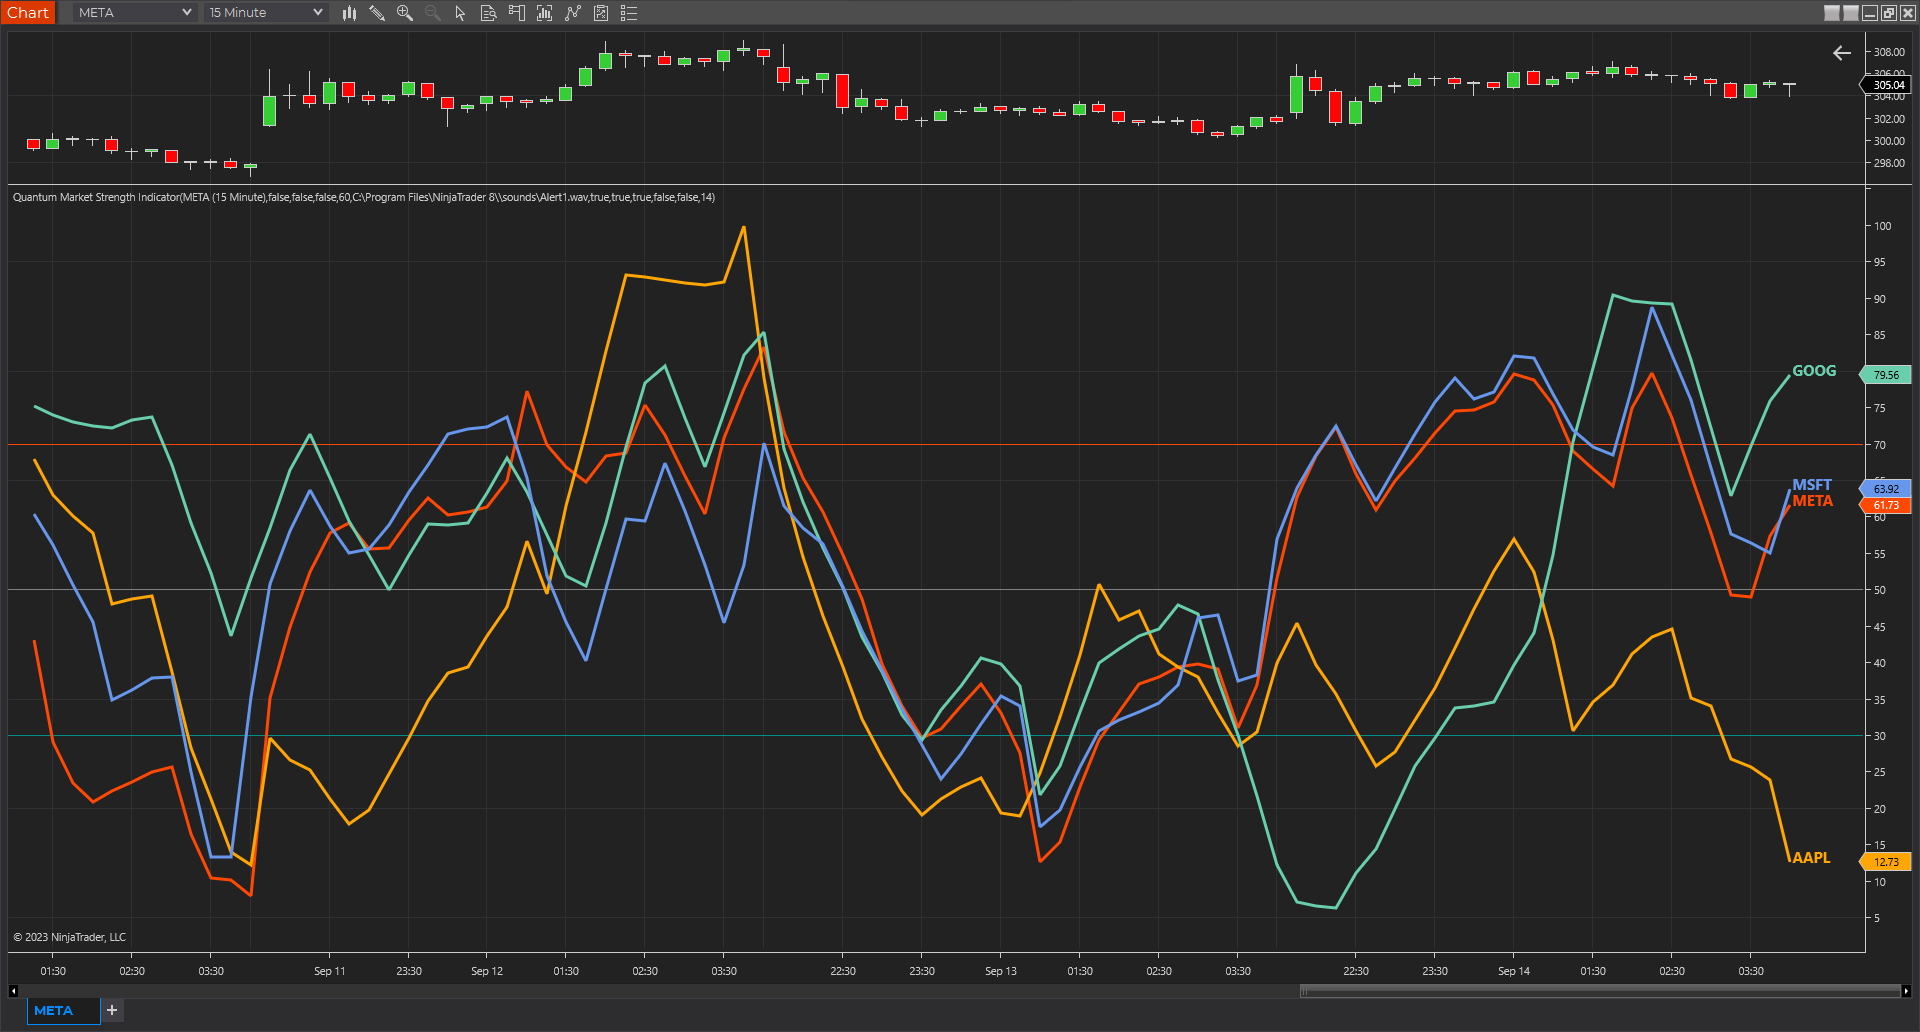
And just like its sister indicator, the CSI, the MSI is an oscillator that moves seamlessly from overbought to oversold and back again between a value of 100 at the top and zero at the bottom, with each instrument or market represented with a single-colored line. To help further, we’ve included two regions on the indicator to represent these states at 70 and 30, respectively, but you can change these accordingly and perhaps extend them further to 80 and 20. These levels are purely intended as guides to help provide additional information as to the market state and a potential reversal in due course.
Now, in a single indicator, you have the opportunity to gauge sentiment across multiple markets, whether these are correlating or not, and from there develop a myriad of trading opportunities, or alternatively give you that all-important confidence to dive in, or maintain an existing position. Through its unique algorithm based on volume, it is another indicator only limited by your imagination, and like all our other indicators, one we urge you to use in multiple timeframes.
Getting started
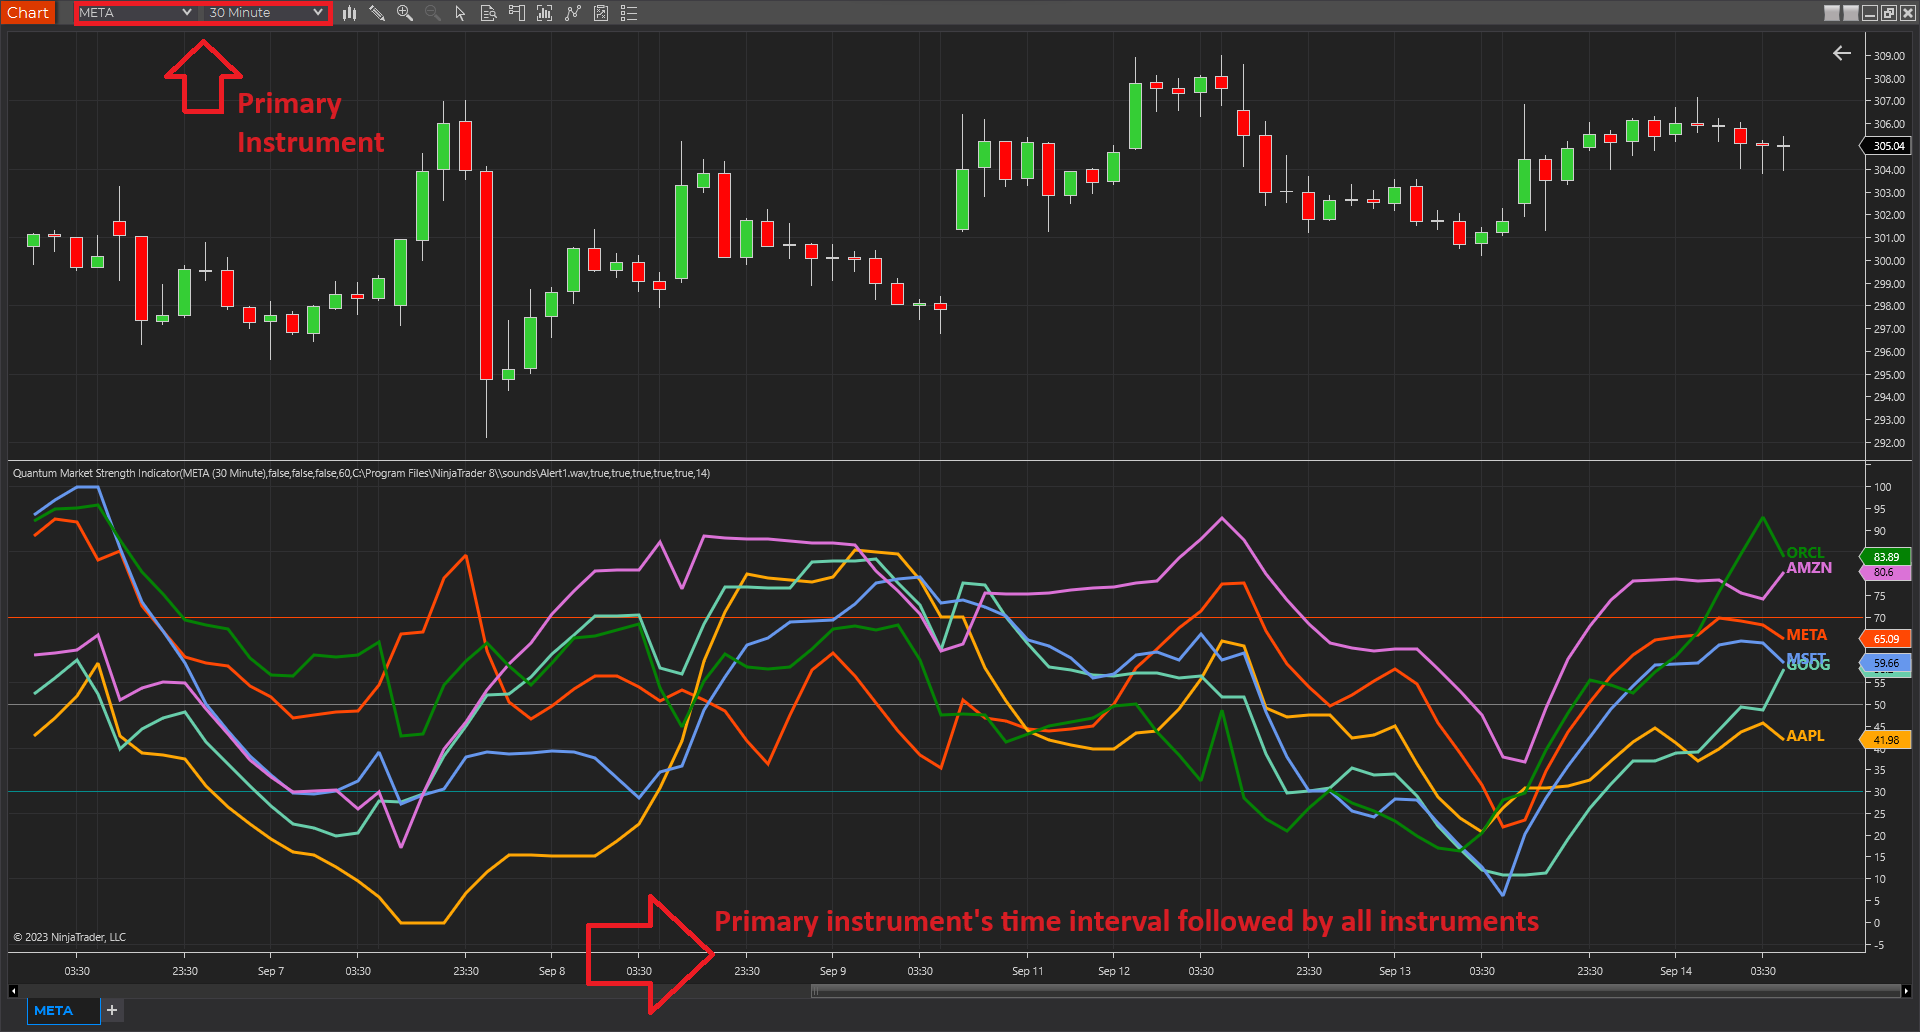
The MSI market strength indicator can calculate and display the strength of up to 6 different instruments at once in the same window but at the minimum, it will always display the chart’s current instrument which we will call the Primary Instrument. You can also identify the MSI’s Primary Instrument in the Input Series property located in the properties window under the Data Series section. Additional instruments can be added in the MSI in the indicator properties window using the Instrument Selector where you can Quick Search any symbol. There are 5 slots for additional instruments labeled Instrument 1, Instrument 2, and up to Instrument 5. If the instrument slot is enabled and the selected symbol exists in your data feed, then it will create a new line within the MSI alongside the Primary Instrument.
Instrument types and timelines
Please keep in mind that every instrument type (stock, future, option, index, forex, cryptocurrency, CFD) has its own session periods that dictate how the intervals in the timeline (the y-axis of the chart) are laid out. This becomes more apparent when adding different types of instruments in the MSI which always use the Primary Instrument’s time axis. All 5 of the additional instruments adapt to the chart’s time-axis which can produce interesting results in different scenarios.
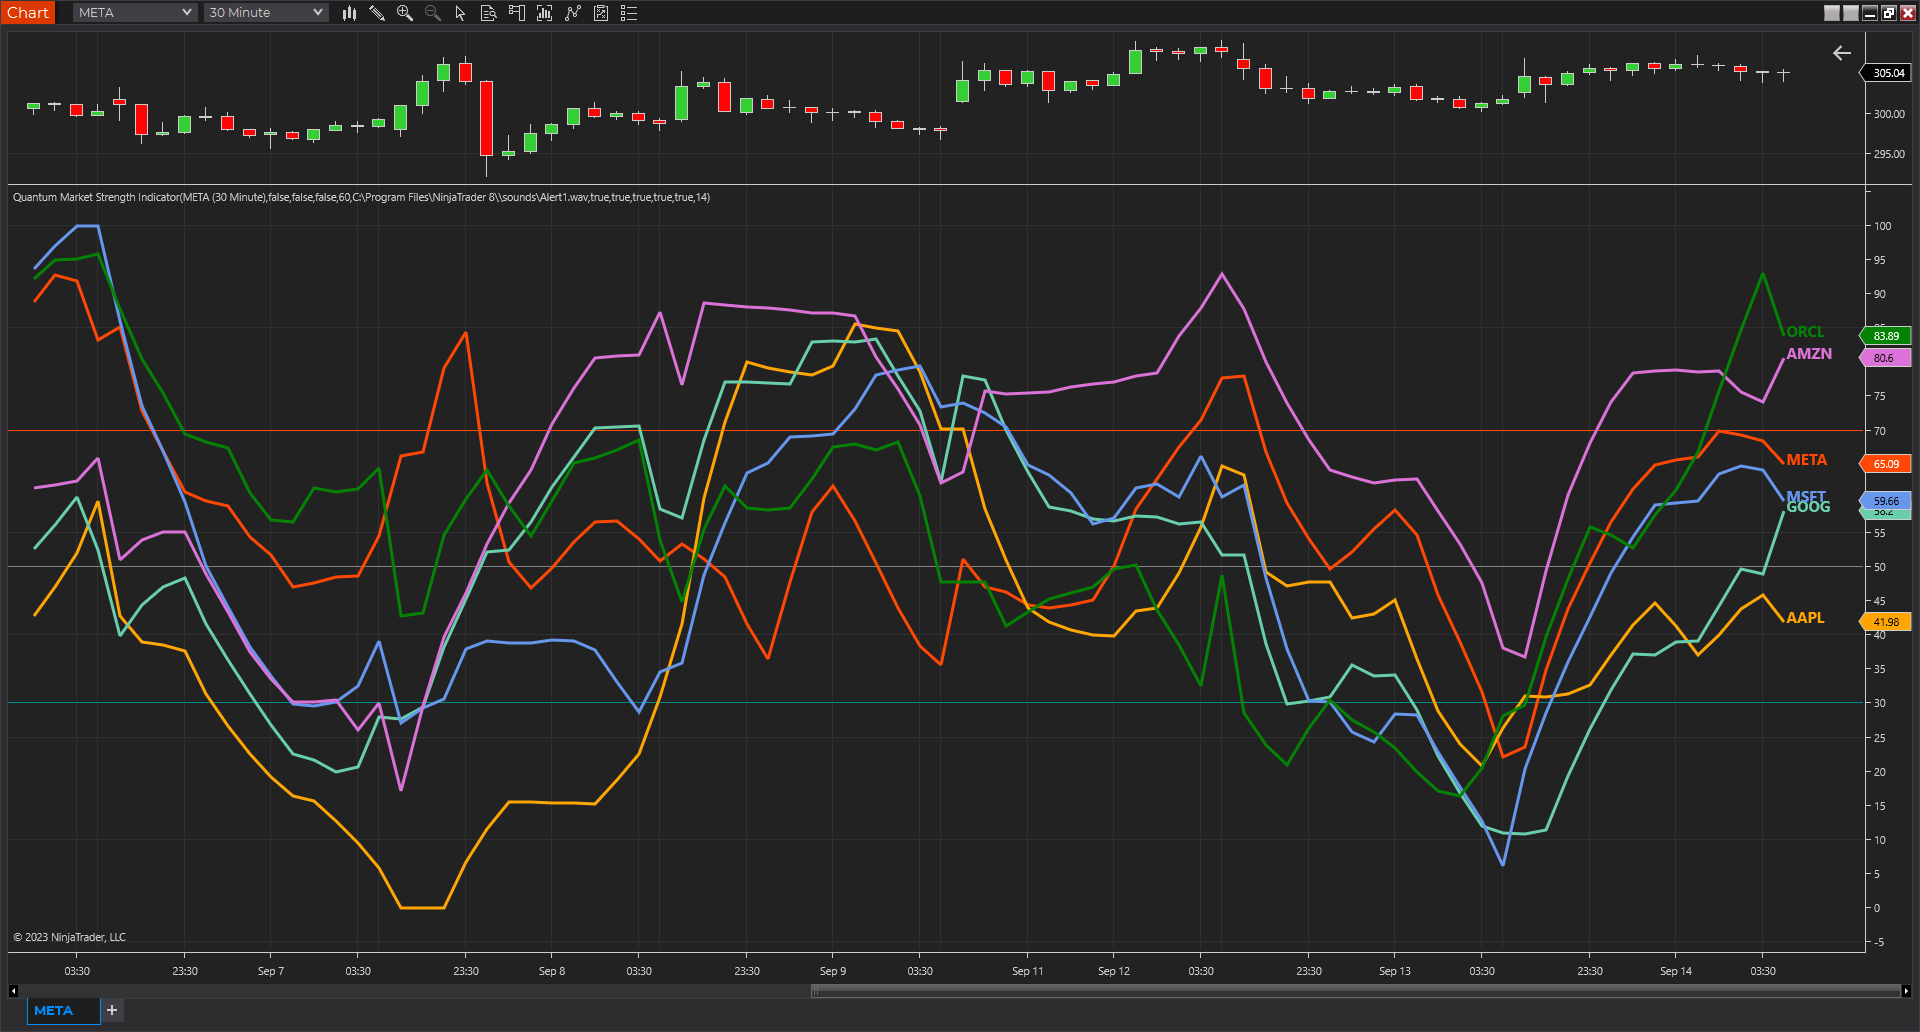
The first scenario is when the added instruments are the same type as the Primary Instrument. For example, the Primary Instrument is a stock and all instruments added are also stocks. The resulting chart is what you would say normal as all data points of all instruments are displayed fully as their sessions align perfectly with each other.
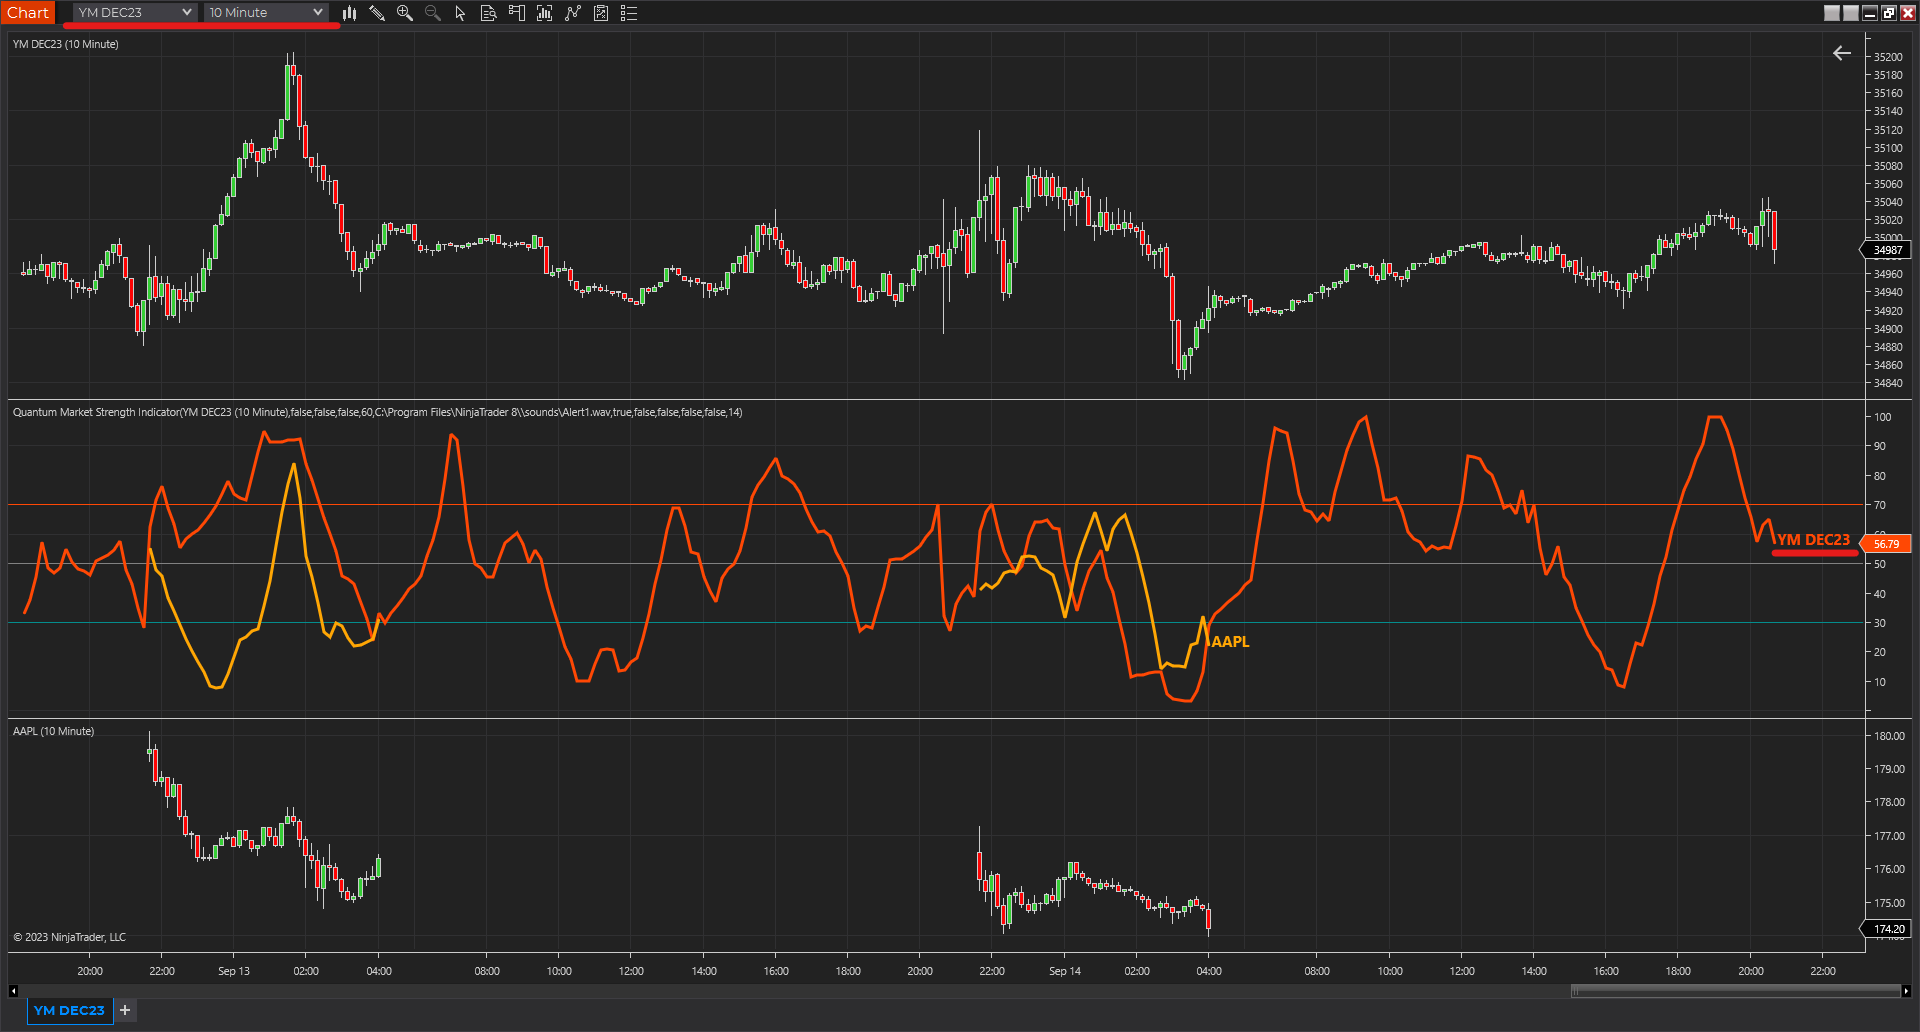
The second scenario is when the added instruments are of different type with different session times. Consider this example: the Primary Instrument is the AAPL stock, but a YM future instrument is added. Because stocks have limited session times compared to futures, YM’s line is incomplete with some of its parts hidden. In this case, the MSI is not able to display YM’s entire output. When the MSI loads in this scenario, causing data points to be omitted, the indicator displays a warning message to inform you of this occurrence. In a different example, YM future is the Primary instrument and the AAPL stock is added. Futures are active in more time periods than stocks which means their time-axis show more date/time than a stock chart. In this case, no data point is omitted as a result, but AAPL’s line will have gaps where the stock was out of session and the future was active.
Example 1: AAPL as Primary Instrument running with YM – data points omitted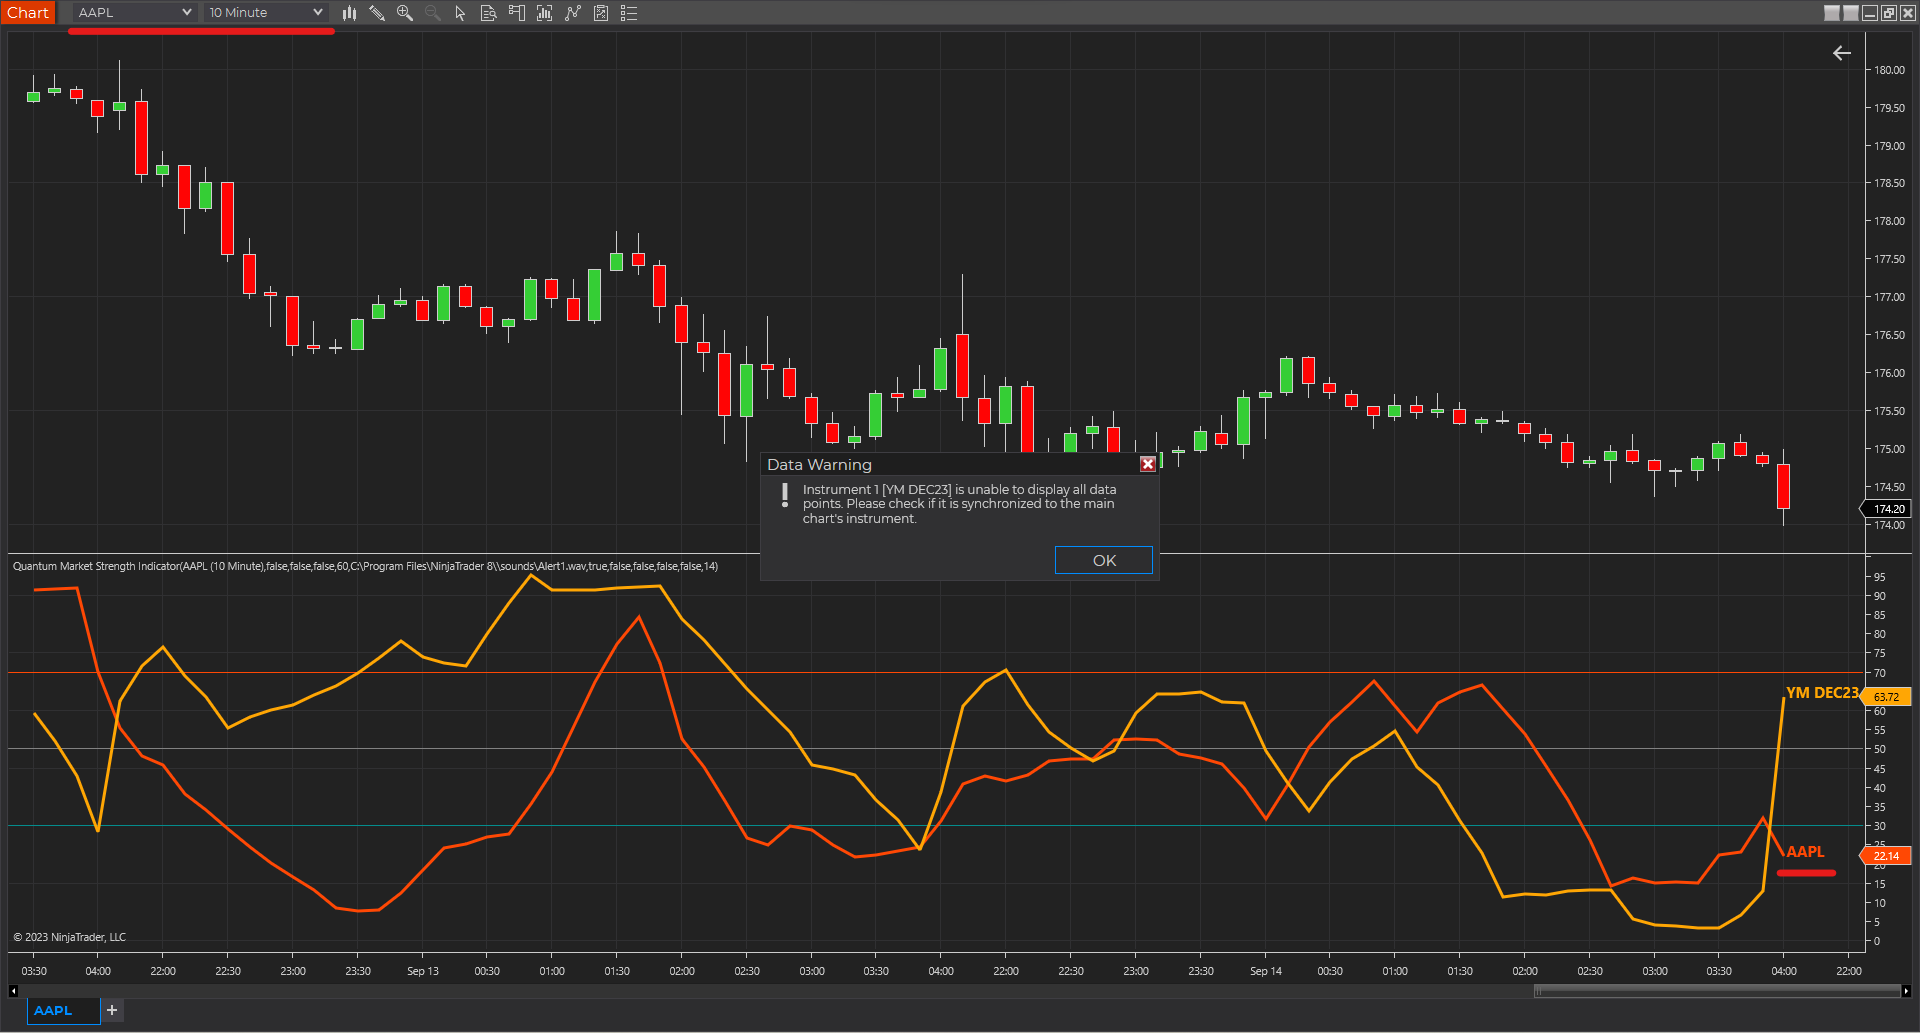
These examples highlight what you need to consider when selecting your Primary Instrument and of the instruments that you plan to add to the indicator.
Installation
Open your NinjaTrader 8 platform and select a chart.
Right click the chart to bring up a menu which looks like the following image:
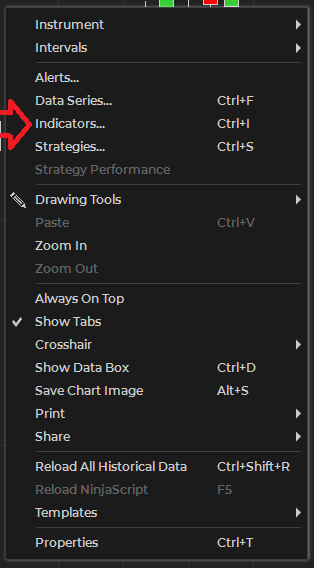
Select Indicators… which will open the following window. Alternatively, you can open this window by clicking the Indicators button in the chart toolbar or by pressing Ctrl + I while focused on the chart.
In the Indicators window under Available section, go to Quantum > Quantum Market Strength Indicator and click it to select the indicator. Once selected, click “add” under the Configured section which will put it on the list of active indicators to be added in the chart.
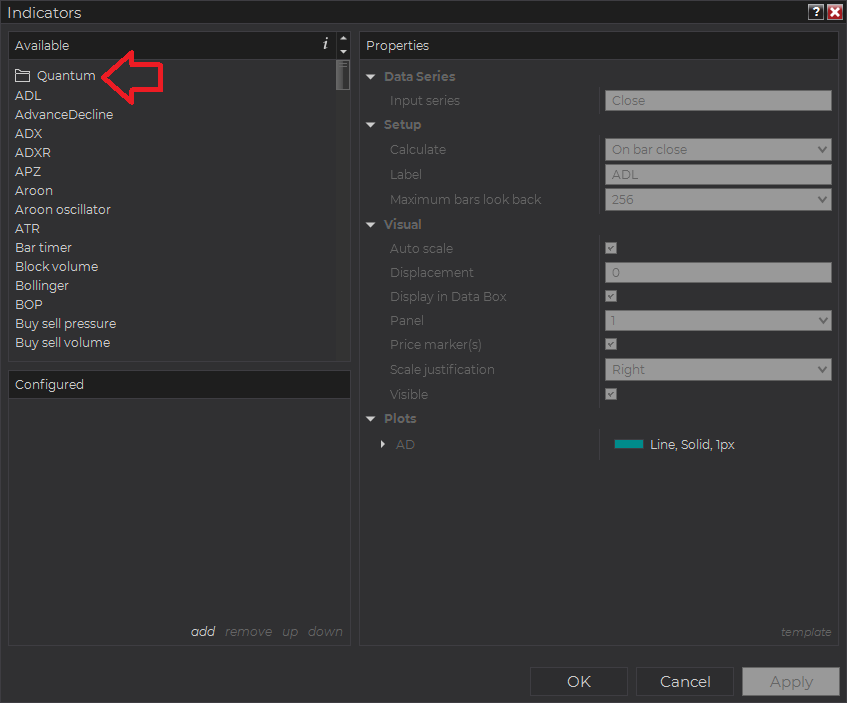
Before clicking the OK or Apply button to complete, the indicator has several configurable options. You can click the Apply button at any time, and this will apply any changes you have made to the indicator without closing the window. This will allow you to see the changes you have made to the indicator, without closing with the OK button or the Cancel button.
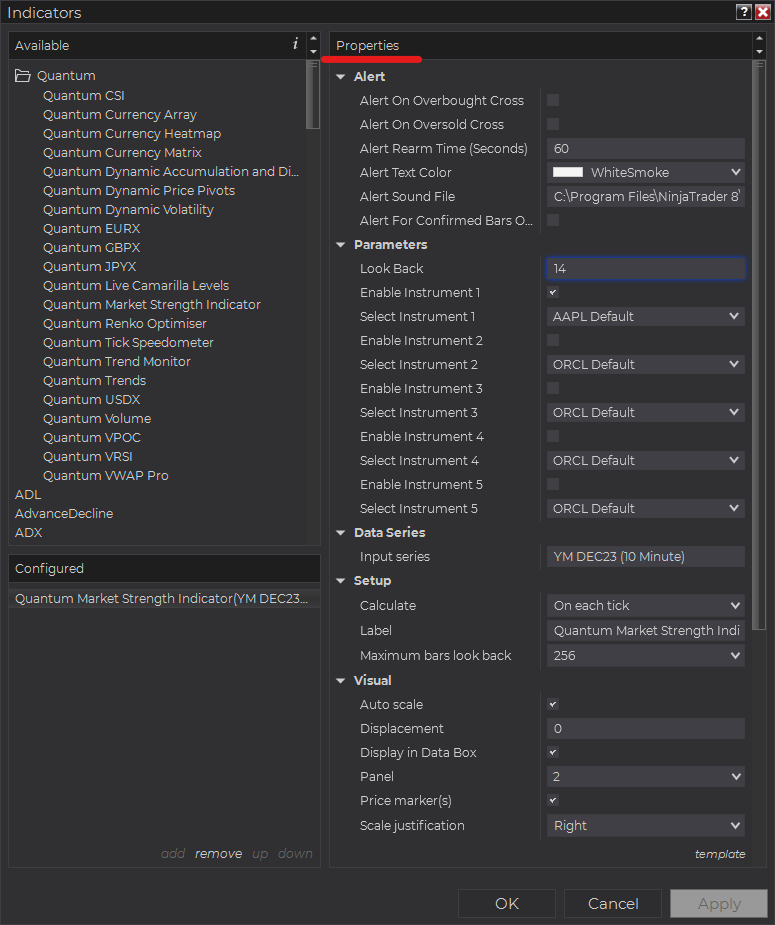
Configuration
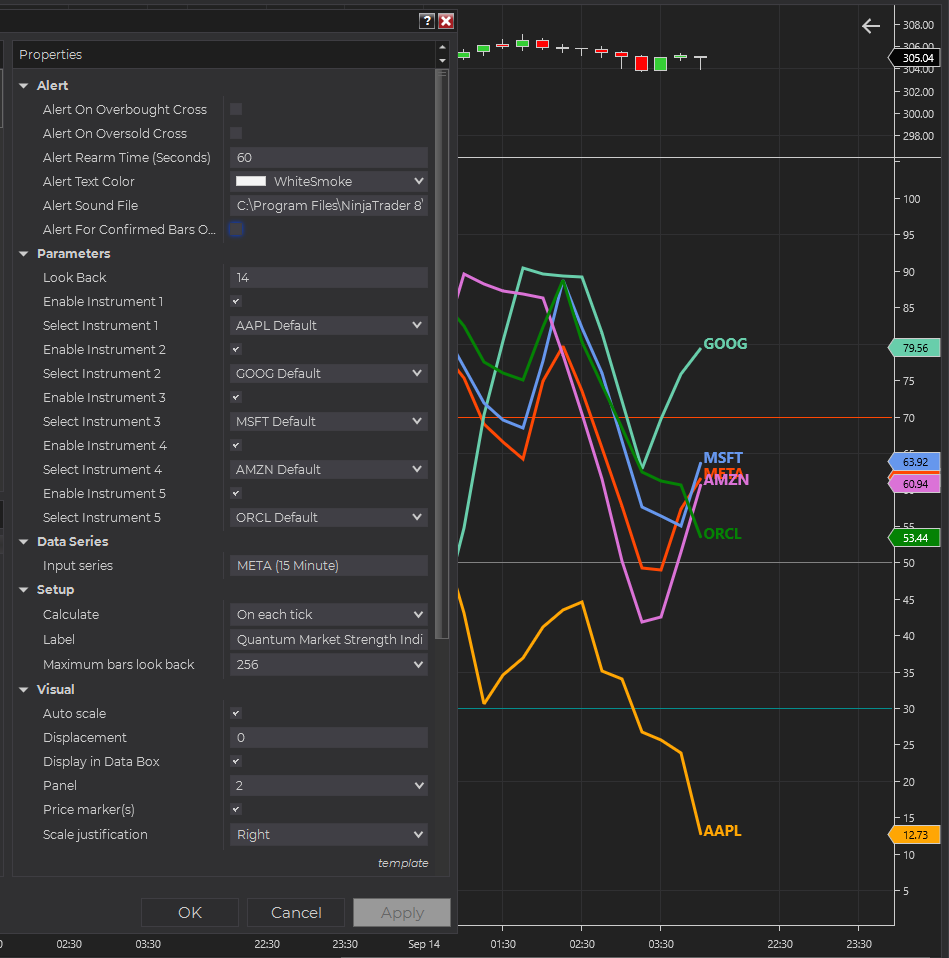
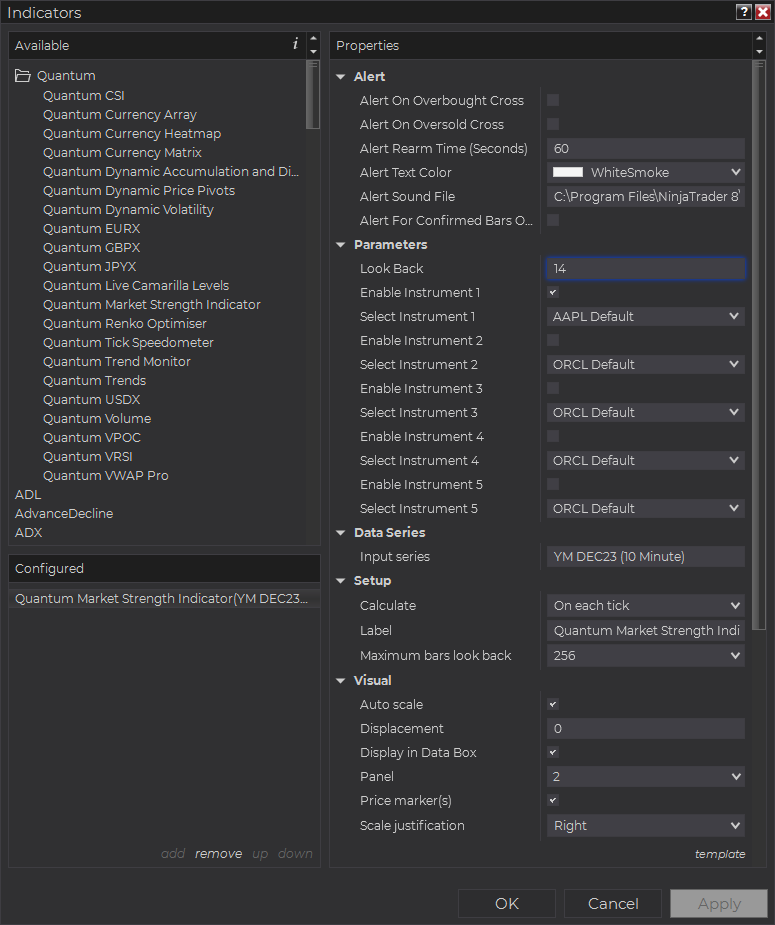
All user inputs can be configured at the right-hand side of the Indicators window under the Properties section. These are the default settings when you add the indicator in a chart.
Main Settings
Alert
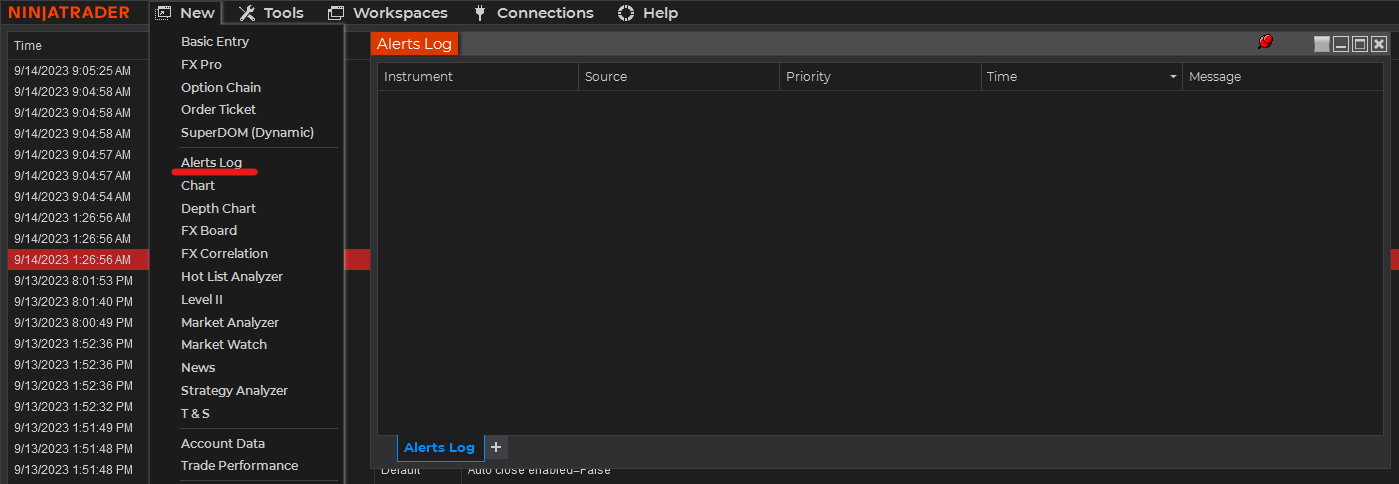
The following settings affect the indicator’s alert notifications displayed in the Alerts Log. You can open the Alerts Log from your NinjaTrader 8 client’s menu bar in the main window at New > Alerts Log.
Alert On Overbought Cross
When enabled, the indicator sends an alert notification in the Alerts Log when the MSI enters or leaves the Overbought level which is 70 and above.
Alert On Oversold Cross
When enabled, the indicator sends an alert notification in the Alerts Log when the MSI enters or leaves the Oversold level which is 30 and below.
Alert Rearm Time (Seconds)
This adds a delay to the next alert notification, expressed in number of seconds.
Alert Text color
This setting allows you to customize the color of the text as the indicator’s messages appear in the Alerts Log.
Alert Sound File
You can change here the sound file the platform uses when this indicator triggers an alert. By default, it uses the Alert1.wav file packaged with your NinjaTrader installation. Please make sure that the file is supported and the absolute path to the sound file is entered correctly.
Alert For Confirmed Bars Only
If this setting is enabled, alerts are not triggered by signals on the open/forming bar. All bars that meet the condition must be closed to trigger an alert.
Parameters
Look Back
This sets the look back period or the number of bars the indicator takes from its roster of instruments to calculate their strength. Its default value is 14 bars.
Enable Instrument 1
Activates the slot for the first instrument.
Select Instrument 1
Identifies the symbol of the first instrument to calculate its strength alongside the main chart’s instrument. It is recommended to select an instrument from the same market as the main chart to ensure all data points are synchronized.
Enable Instrument 2
Activates the slot for the second instrument.
Select Instrument 2
Identifies the symbol of the second instrument to calculate its strength alongside the main chart’s instrument. It is recommended to select an instrument from the same market as the main chart to ensure all data points are synchronized.
Enable Instrument 3
Activates the slot for the third instrument.
Select Instrument 3
Identifies the symbol of the third instrument to calculate its strength alongside the main chart’s instrument. It is recommended to select an instrument from the same market as the main chart to ensure all data points are synchronized.
Enable Instrument 4
Activates the slot for the fourth instrument.
Select Instrument 4
Identifies the symbol of the fourth instrument to calculate its strength alongside the main chart’s instrument. It is recommended to select an instrument from the same market as the main chart to ensure all data points are synchronized.
Enable Instrument 5
Activates the slot for the fifth instrument.
Select Instrument 5
Identifies the symbol of the fifth instrument to calculate its strength alongside the main chart’s instrument. It is recommended to select an instrument from the same market as the main chart to ensure all data points are synchronized.
Other Settings
Data Series
Input Series
Opens the indicator Input Series dialogue which allows you to select the source of data for your indicator’s calculations.
Setup
Calculate
Sets the frequency at which the indicator performs its calculations.
Label
The label of the indicator’s instance displayed on the chart.
Maximum bars look back
Determines the maximum number of bars the indicator can look back to perform calculations on historical data. This is set to 256 by default (the most memory-friendly setting), but it can be changed to “infinite” to allow for a greater look back period.
Visual
Auto scale
When enabled, the indicator will be included in the chart panel’s vertical automatic scaling.
Displacement
Sets the number of bars by which to displace the indicator plots.
Display in Data Box
Enables or disables the inclusion of the indicator’s plot values in the Data Box
Panel
Sets the panel in which the indicator is plotted. If you select “Same as input series,” the indicator will be linked to the Input Series and automatically move if the Input Series is modified to a different panel.
Price marker(s)
When enabled, the indicator value is plotted in the axis selected under the “Scale Justification” property.
Scale justification
Sets the scale on which the indicator will be plotted. Possible values are “Right,” “Left,” and “Overlay”.
Visible
Enables or disables visibility and function of the indicator on the chart.
Plots & Lines
Sets a variety of parameters, such as color, for the plots drawn by the indicator.
- Oversold
- Zero line
- Overbought
- INST0
- INST1
- INST2
- INST3
- INST4
- INST5
Unloading the indicator
Here are the steps to remove the indicator in the chart.
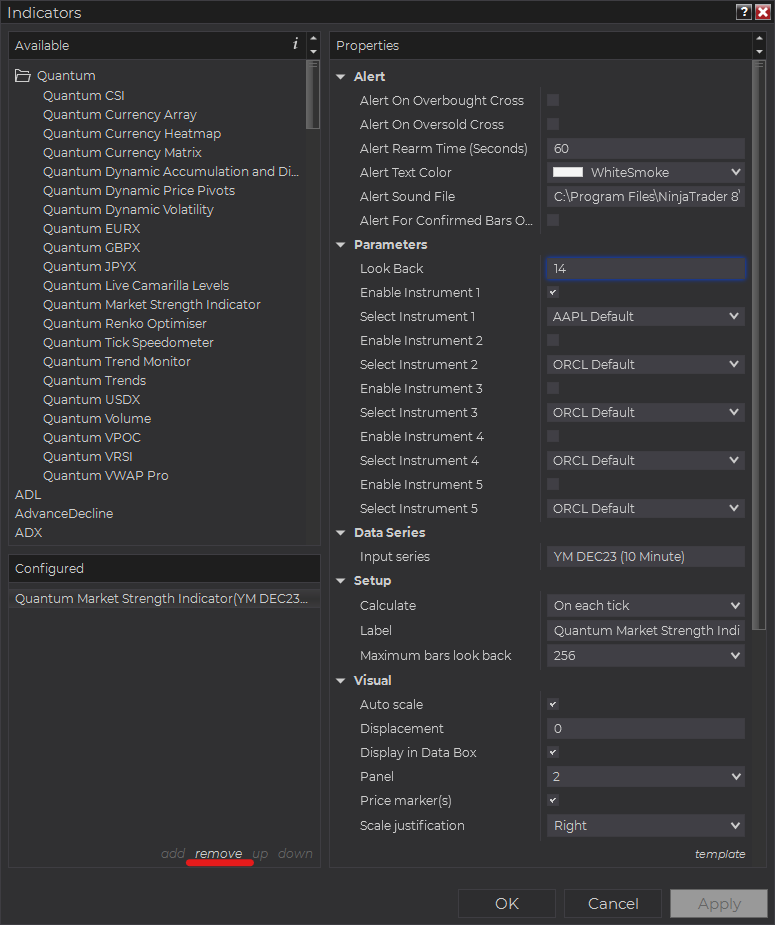
Right-click on the chart then select Indicators… from the menu. Select Quantum Market Strength Indicator from the Configured section and click “remove” then OK to confirm and the indicator should be unloaded from your chart.
Using the Quantum Market Strength Indicator in the NinjaTrader Market Analyzer
Valid Rows
The Quantum Market Strength Indicator works in any instrument with historical volume data.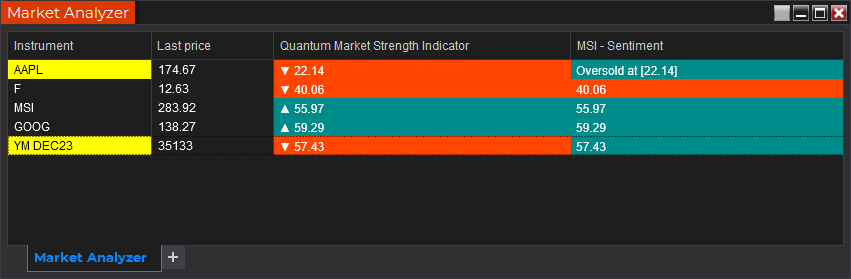
Adding the Quantum Market Strength Indicator as a Market Analyzer Column
Here are the basic steps to add the Quantum Market Strength Indicator in the Market Analyzer:
Make sure valid rows are present in the Market Analyzer window.
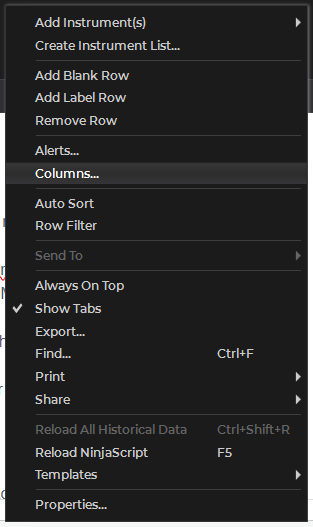
Right-click anywhere in the Market Analyzer window then select “Columns…” in the context menu.
The Columns window appears. In the Available section, go to QuantumMarketAnalyzerColumns folder then double-click the Quantum Market Strength Indicator to add the indicator as one of the columns in the Market Analyzer.
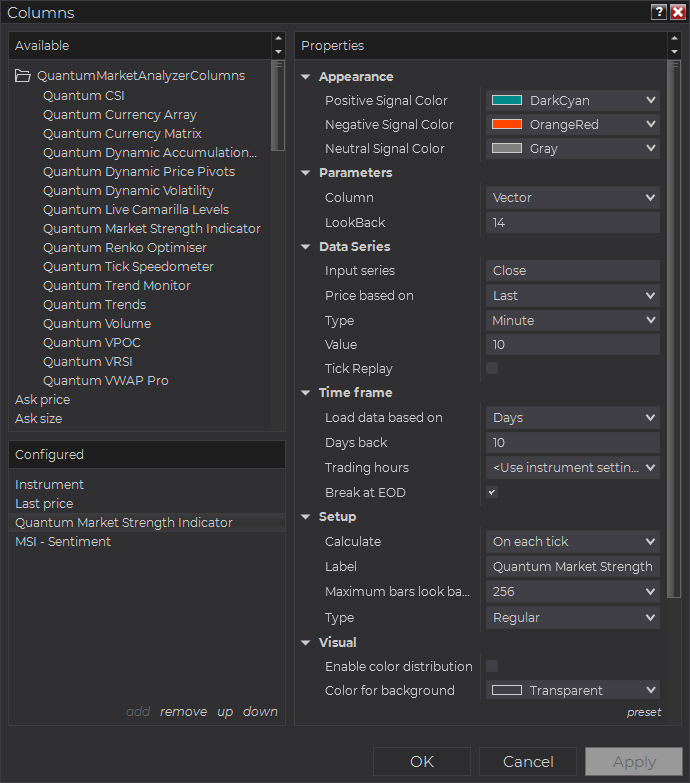
Select the type of information you like to display using the Column drop down menu under the Properties section of the indicator.
Set the timeframe of the indicator in Properties > Data Series section with the following user inputs:
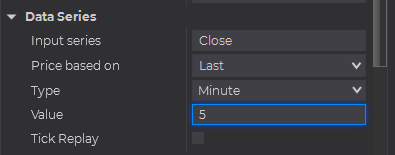
Type – select a time-based series such as Minute or Day
Value – set the interval for the type of series selected above
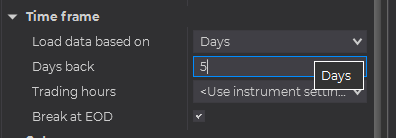
When running the indicator in timeframes less than Hourly intervals, please configure the “Load data based on” property to “Days” and the “Days back” property to the default value of 5 days to ensure that there is enough data for the indicator to work with.
After you have finished all your configurations, click OK to confirm your chosen settings and to add the indicator as a column in your Market Analyzer window.
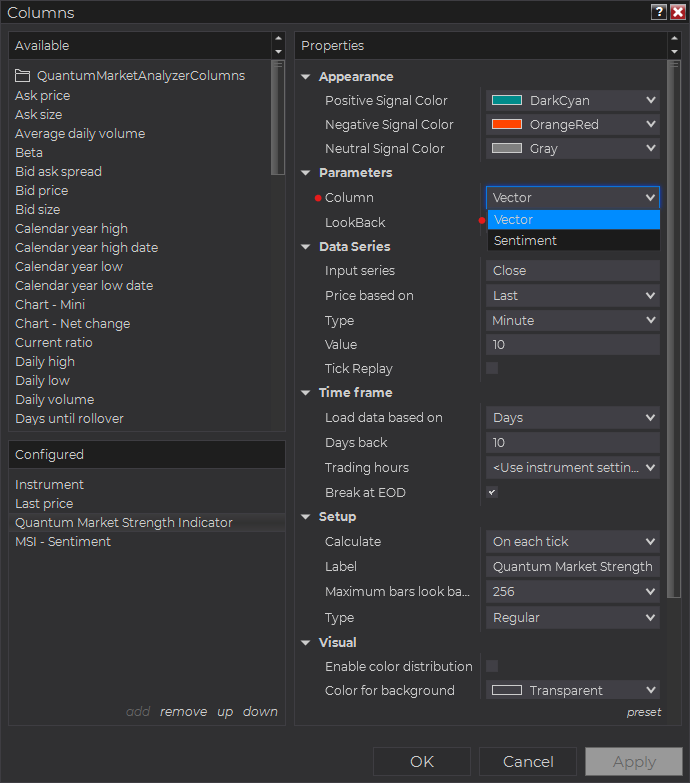
Column Options
The Quantum Market Strength Indicator is a multi-faceted indicator that can display different types of signals which can be selected through its Column drop down menu found under the Properties section. You can customize the indicator’s function in the Market Analyzer by selecting any of the options enumerated below.
- Vector – displays the current direction of the VRSI (up, down, or horizontal) and its current value.
- Sentiment – displays the current value of the VRSI and adds a message that tells the user if the instrument is found to be Overbought or Oversold.
Tip: You can change the Label property of the column to describe what type of signal you choose to display.


