Introduction
Staying in any trend is the hardest thing to do in trading, without question which is why we developed the Quantum Trend Monitor indicator, to help you do just that.
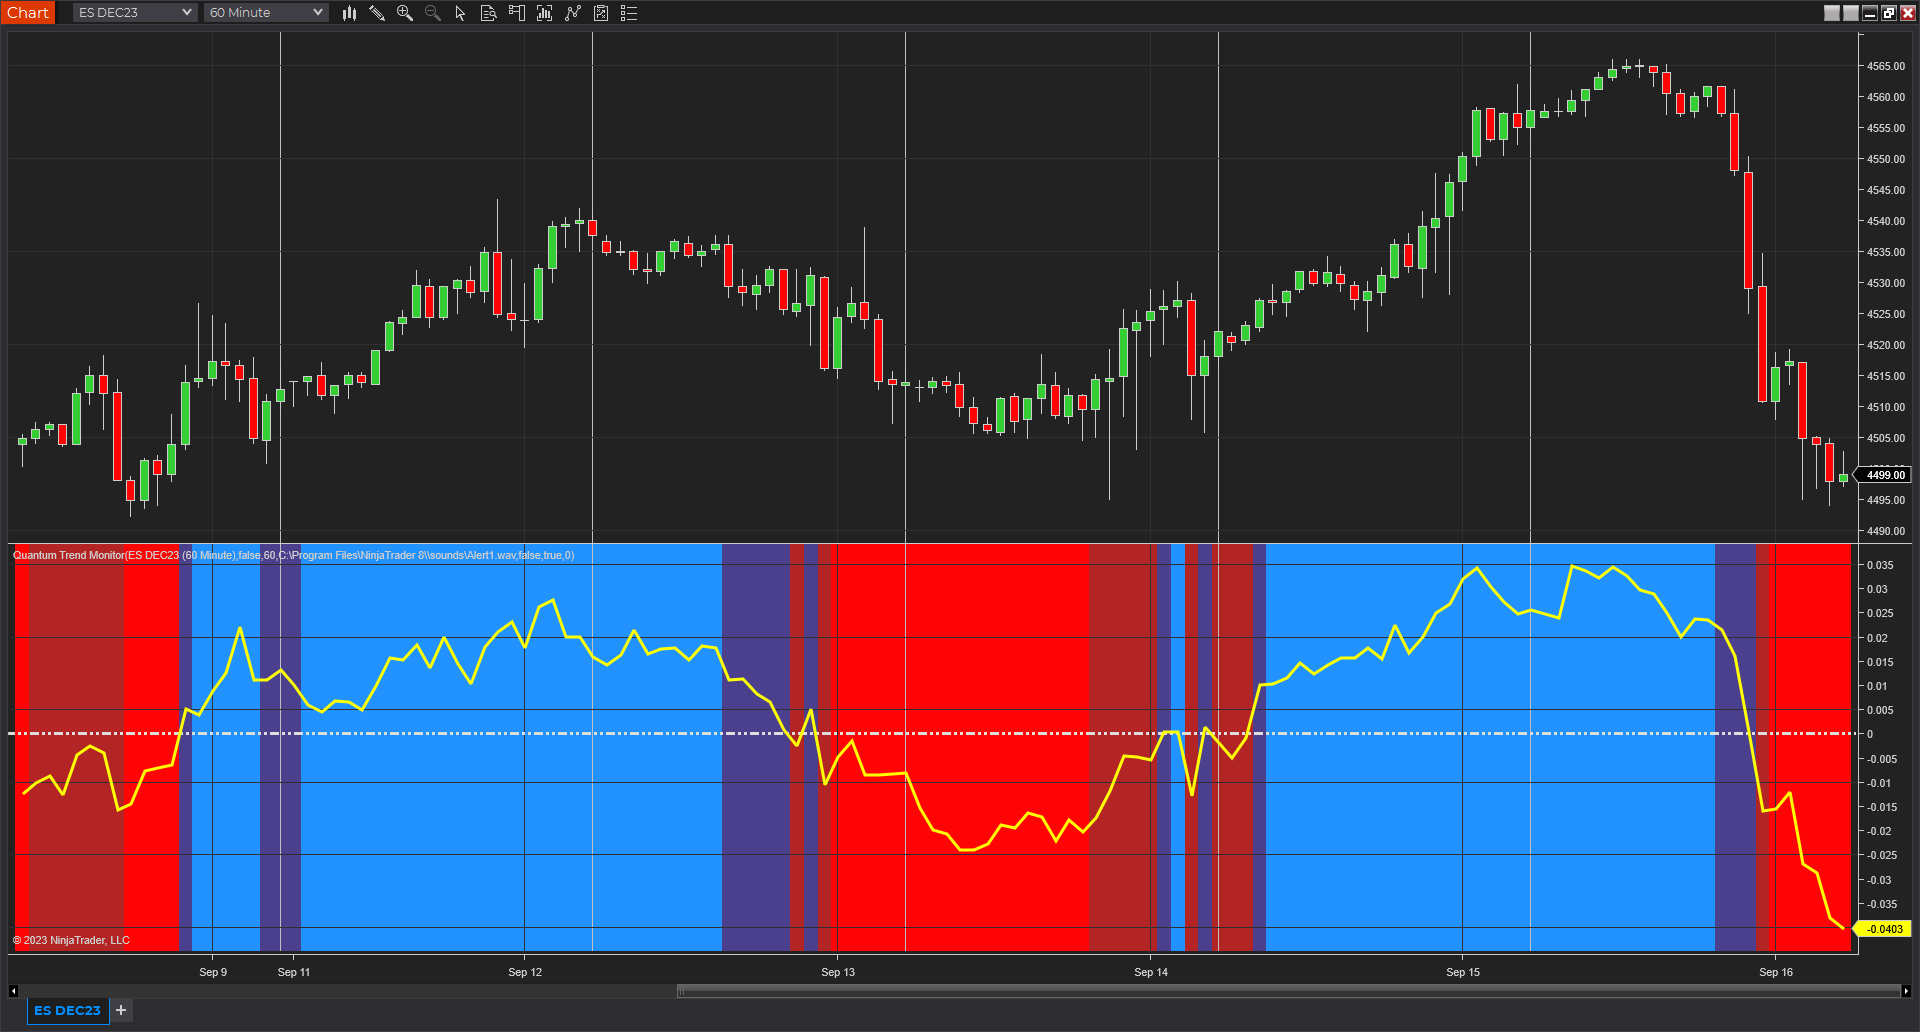
The Quantum Trend Monitor is in fact two indicators in one. It’s been designed to help you stay in trends once they begin, but also to signal when a trend is potentially coming to an end or is simply pausing before continuing further. The indicator is best used in conjunction with the Quantum Trends Indicator. The Trend Monitor aims to smooth out the minor pullbacks and reversals which are all part and parcel of the price action, helping to keep you in the trend to maximise the profit potential from every position. This is the function of the solid bar, which displays four colors.
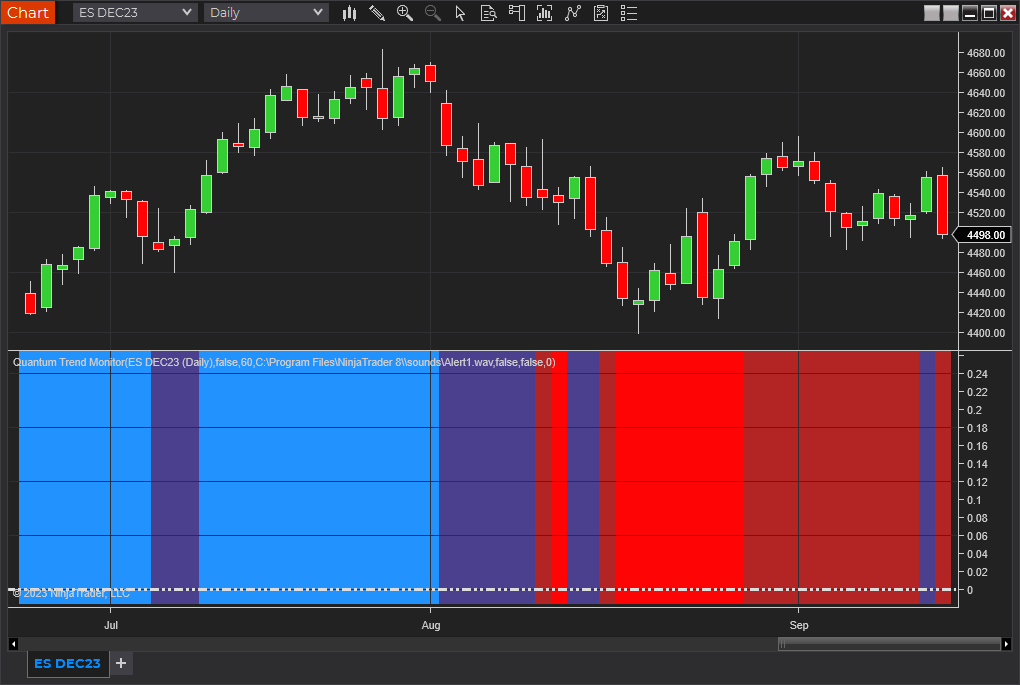
- When the market is trending strongly, the Trend Monitor is either bright red or bright blue.
- When the market is in transition or at a pause point, the Trend Monitor is either dark red or dark blue.
- If the Trend Monitor transitions from one bright color to another, (from red to blue, or form blue to red) this is signaling the current trend has potentially come to an end.
The Trend Monitor smooths out the ups and downs in a trend, which will be reflected in your Quantum Trends, which then provides the ‘fine detail’ of every move.
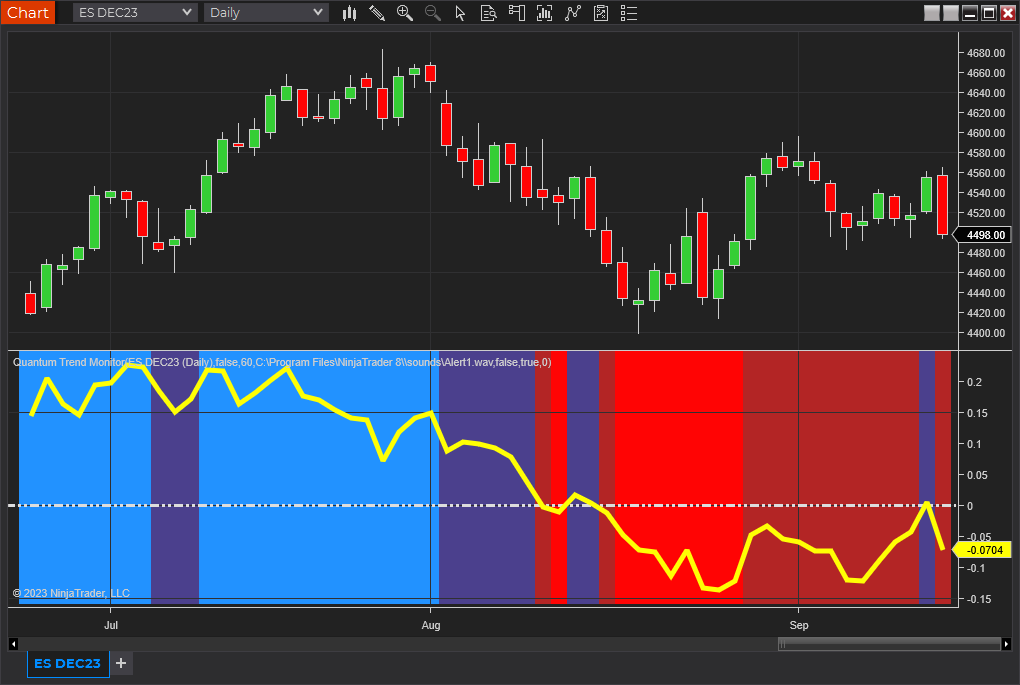
The second element of the Trend Monitor is the yellow trend line, which displays the ‘strength’ of the trend, and gives an additional perspective on the trend itself. The trend line moves above and below the ‘mean’ which is displayed as a white dotted line on the indicator. As the trend develops, the yellow trend line moves above and below the mean level, and as it reaches the extremes, this is another potential signal the trend is becoming exhausted. The trend line indicator can be enabled in the indicator properties which can appear alongside the coloured bars to serve as a guide. As with all the Quantum trading indicators, the Quantum Trend Monitor is best used in multiple timeframes which will give you visual signals to changes in trend, both upstream and downstream of your principal trading chart.
The Quantum Trend Monitor indicator works in all timeframes.
The indicator can be ‘fine-tuned’ to your own preferences in terms of the speed with which the indicator will react to possible changes in trend.
For clarity, we find it is best applied to the bottom of the chart.
Installation
Open your NinjaTrader 8 platform and select a chart.
Right click the chart to bring up a menu which looks like the following image:
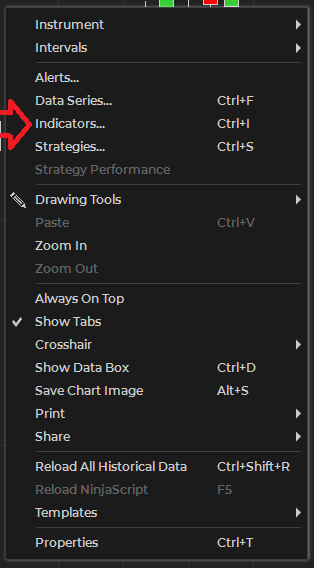
Select Indicators… which will open the following window. Alternatively, you can open this window by clicking the Indicators button in the chart toolbar or by pressing Ctrl + I while focused on the chart.
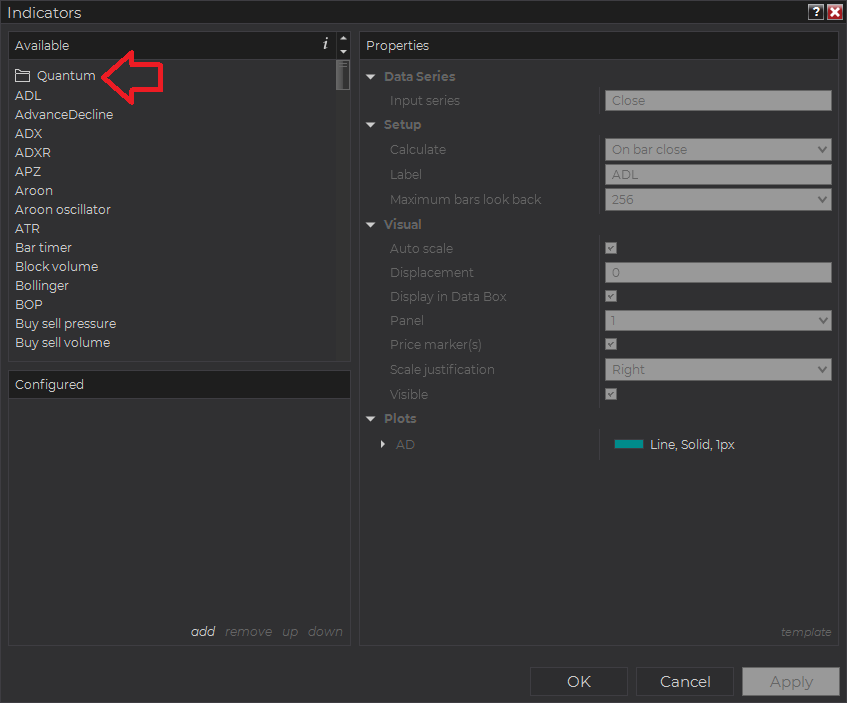
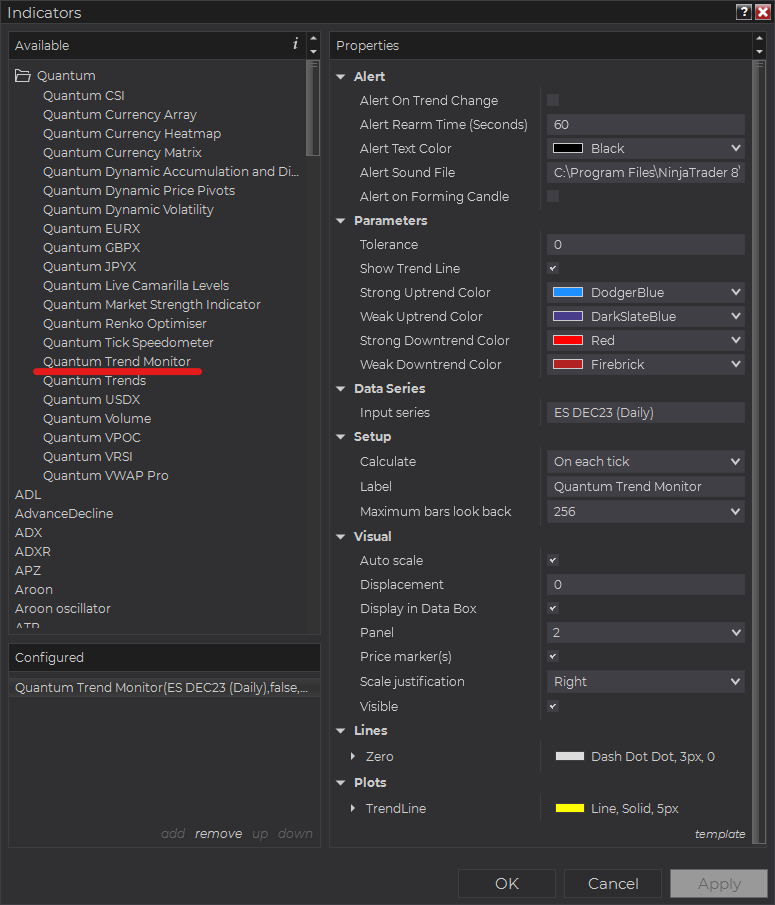
In the Indicators window under Available section, go to Quantum > Quantum Trend Monitor and click it to select the indicator. Once selected, click “add” under the Configured section which will put it on the list of active indicators to be added in the chart.
Before clicking the OK or Apply button to complete, the indicator has several configurable options. You can click the Apply button at any time, and this will apply any changes you have made to the indicator without closing the window. This will allow you to see the changes you have made to the indicator, without closing with the OK button or the Cancel button.
Configuration
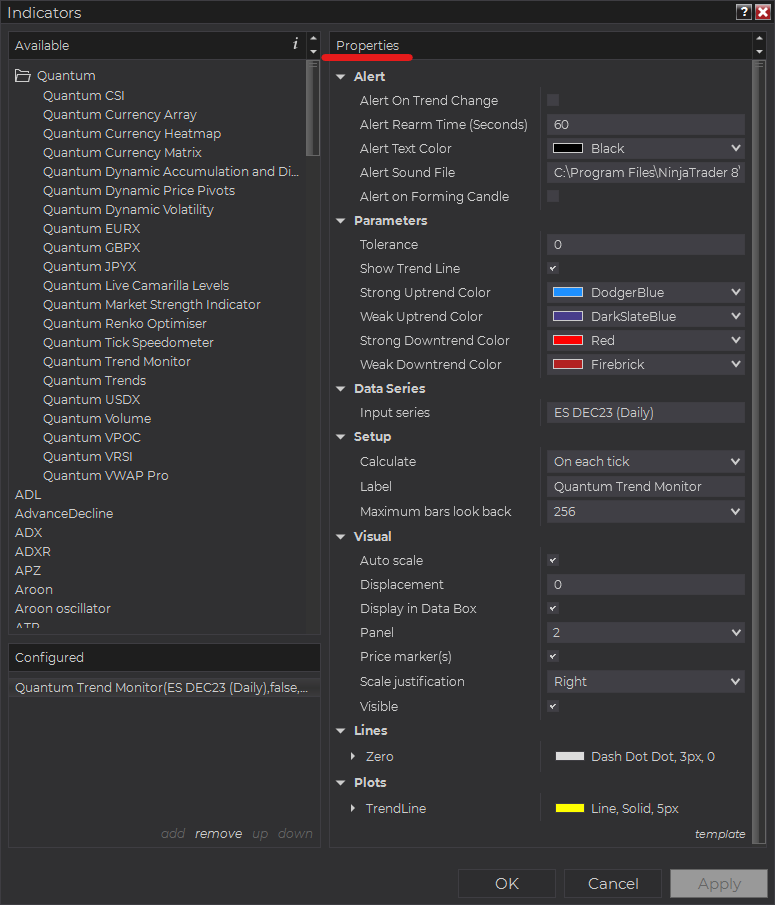
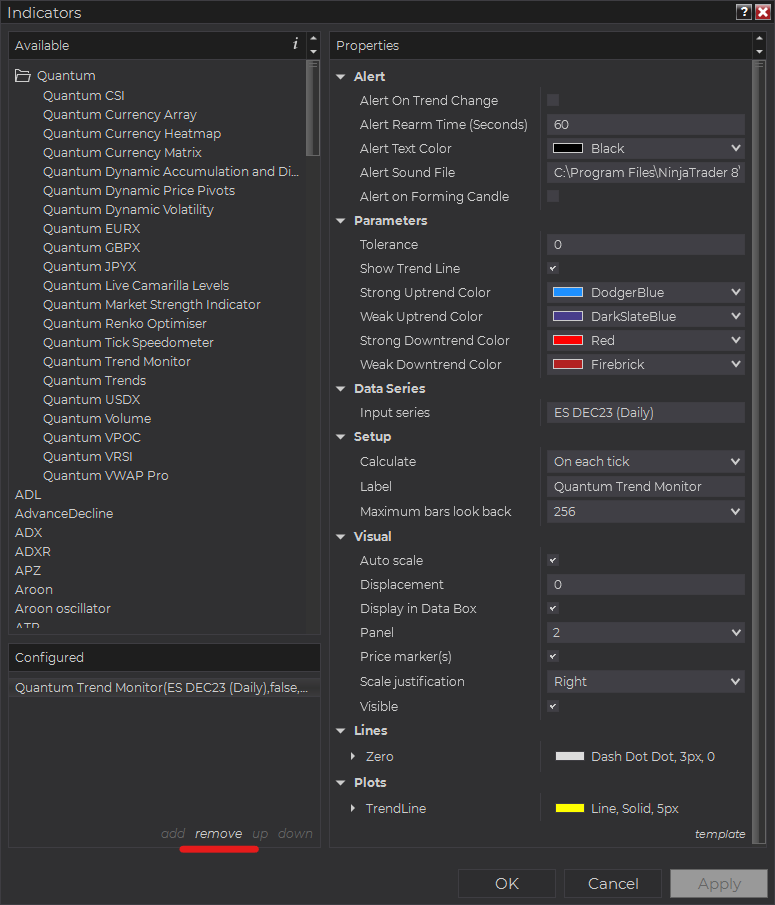
All user input can be configured at the right-hand side of the Indicators window under the Properties section. These are the default settings when you add the indicator in a chart.
Main Settings
Alert
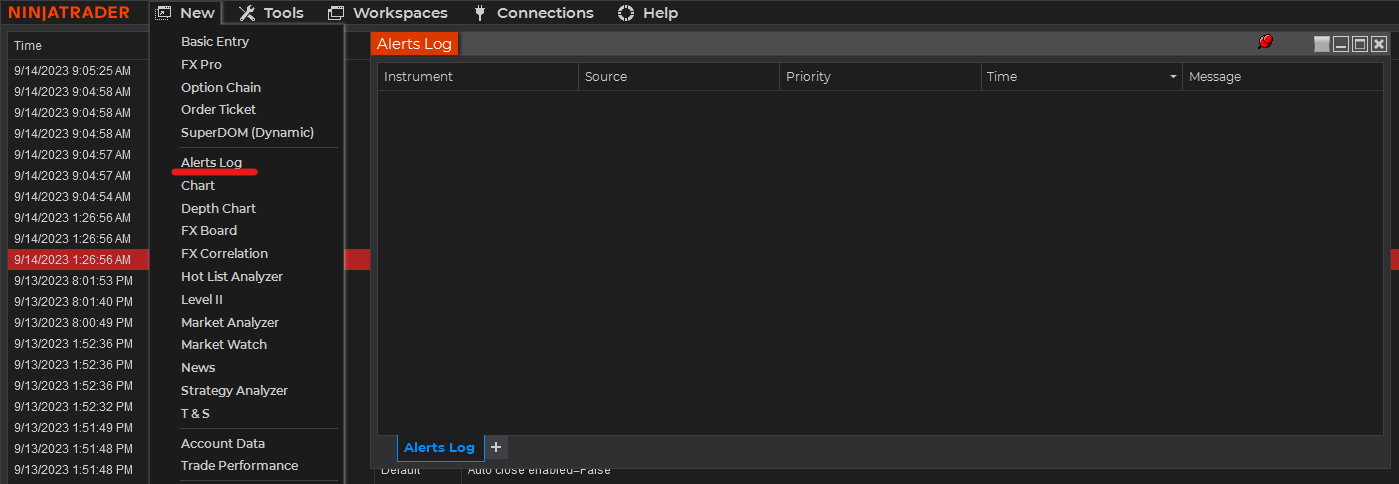
The following settings affect the indicator’s alert notifications displayed in the Alerts Log. You can open the Alerts Log from your NinjaTrader 8 client’s menu bar in the main window at New > Alerts Log.
Alert On Trend Change
When enabled, the indicator sends an alert notification in the Alerts Log when trend sentiment changes which manifests as a change of color in the Trend Monitor.
Alert Rearm Time (Seconds)
This adds a delay to the next alert notification, expressed in number of seconds.
Alert Text Color
This setting allows you to customize the color of the text as the indicator’s messages appear in the Alerts Log.
Alert Sound File
You can change here the sound file the platform uses when this indicator triggers an alert. By default, it uses the Alert1.wav file packaged with your NinjaTrader installation. Please make sure that the file is supported and the absolute path to the sound file is entered correctly.
Alert Current Speed on Forming Candle
When enabled, the alert triggers shift from the most recently closed candlestick to the forming candle.
Parameters
Tolerance
Tolerance is a factor used by the indicator to smooth out the noise in the chart’s price action. As you increase its value, easing in and out of stronger trends become more apparent.
Show Trend Line
Shows or hides the Trend Line element of the indicator.
Strong Uptrend Color
Sets the color of the Strong Uptrend signal.
Weak Uptrend Color
Sets the color of the Weak Uptrend signal on the chart and in the Alert Log.
Strong Downtrend Color
Sets the color of the Strong Downtrend signal on the chart and in the Alert Log.
Weak Downtrend Color
Sets the color of the Weak Downtrend signal on the chart and in the Alert Log.
Other Settings
Data Series
Input Series
Opens the indicator Input Series dialogue which allows you to select the source of data for your indicator’s calculations.
Setup
Calculate
Sets the frequency at which the indicator performs its calculations.
Label
The label of the indicator’s instance displayed on the chart.
Maximum bars look back
Determines the maximum number of bars the indicator can look back to perform calculations on historical data. This is set to 256 by default (the most memory-friendly setting), but it can be changed to “infinite” to allow for a greater look back period.
Visual
Auto scale
When enabled, the indicator will be included in the chart panel’s vertical automatic scaling.
Displacement
Sets the number of bars by which to displace the indicator plots.
Display in Data Box
Enables or disables the inclusion of the indicator’s plot values in the Data Box
Panel
Sets the panel in which the indicator is plotted. If you select “Same as input series,” the indicator will be linked to the Input Series and automatically move if the Input Series is modified to a different panel.
Price marker(s)
When enabled, the indicator value is plotted in the axis selected under the “Scale Justification” property.
Scale justification
Sets the scale on which the indicator will be plotted. Possible values are “Right,” “Left,” and “Overlay”.
Visible
Enables or disables visibility and function of the indicator on the chart.
Plots & Lines
Sets a variety of parameters, such as color, for the plots drawn by the indicator.
- Zero
- TrendLine
Unloading the indicator
Here are the steps to remove the indicator in the chart and in the Alert Log.
Right-click on the chart then select Indicators… from the menu. Select Quantum Trend Monitor from the Configured section and click “remove” then OK to confirm and the indicator should be unloaded from your chart.
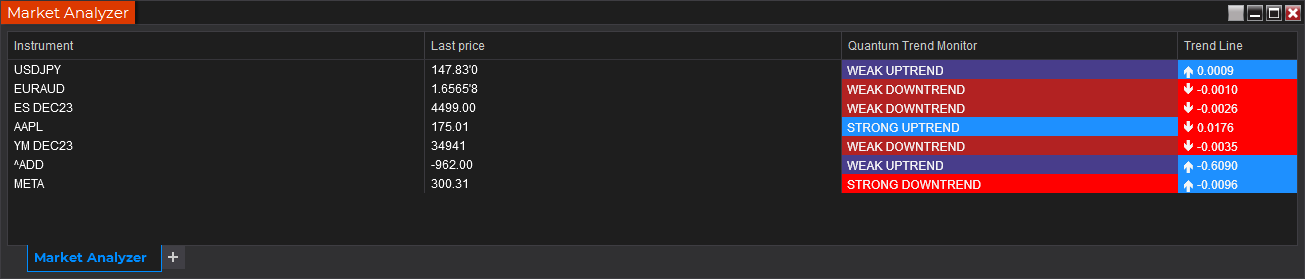
Using the Quantum Trend Monitor in the NinjaTrader Market Analyzer
Valid Rows
The Quantum Trend Monitor indicator works in any instrument.
Adding the Quantum Trend Monitor as a Market Analyzer Column
Here are the basic steps to add the Quantum Trend Monitor in the Market Analyzer:
Make sure valid rows are present in the Market Analyzer window.
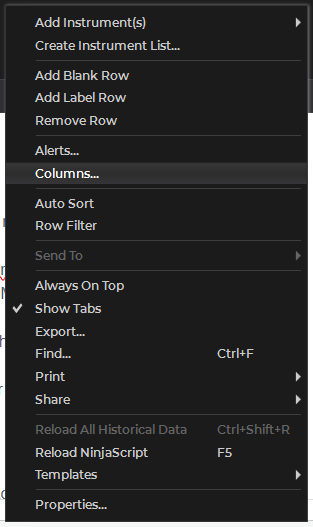
Right-click anywhere in the Market Analyzer window then select “Columns…” in the context menu.
The Columns window appears. In the Available section, go to QuantumMarketAnalyzerColumns folder then double-click the Quantum Trend Monitor to add the indicator as one of the columns in the Market Analyzer.
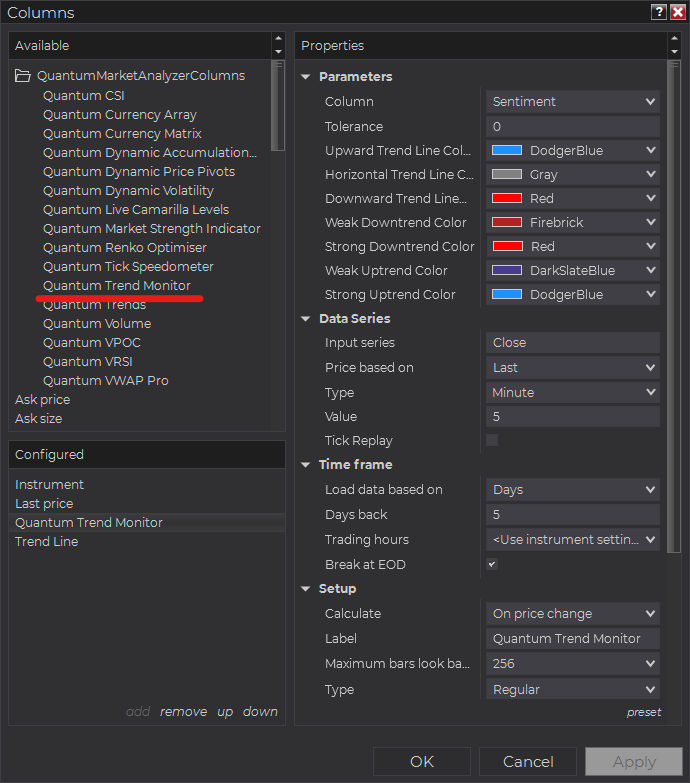
Select the type of information you like to display using the Column drop down menu under the Properties section of the indicator.
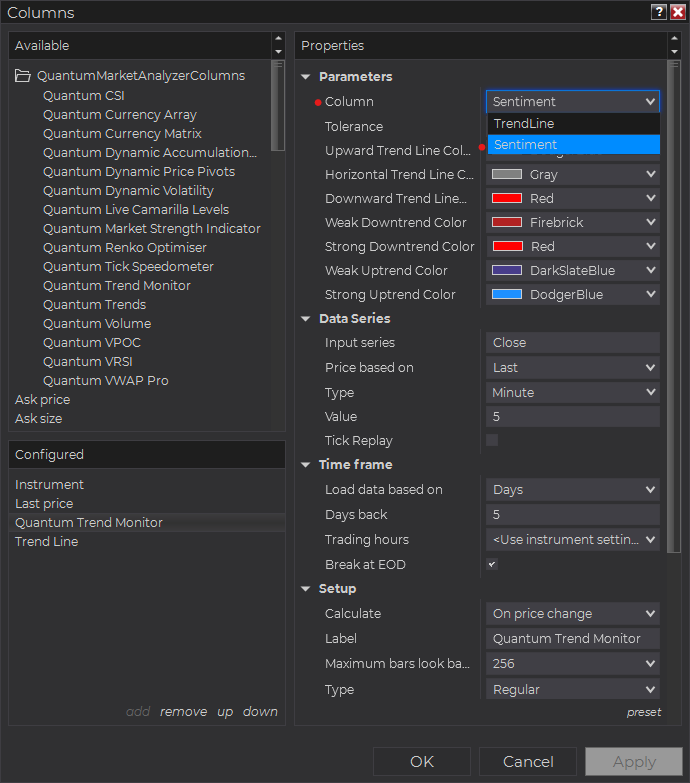
Set the timeframe of the indicator in Properties > Data Series section with the following user inputs:
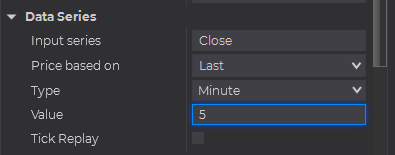
Type – select a time-based series such as Minute or Day
Value – set the interval for the type of series selected above
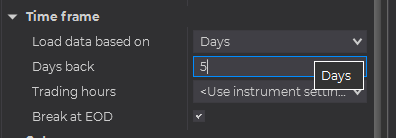
When running the indicator in timeframes less than Hourly intervals, please configure the “Load data based on” property to “Days” and the “Days back” property to the default value of 5 days to ensure that there is enough data for the indicator to work with.
After you have finished all your configurations, click OK to confirm your chosen settings and to add the indicator as a column in your Market Analyzer window.
Column Options
The Quantum Trend Monitor is a multi-faceted indicator that can display different types of signals which can be selected through its Column drop down menu found under the Properties section. You can customize the indicator’s function in the Market Analyzer by selecting any of the options enumerated below.
- TrendLine – displays the current direction of the Trend Line plot (up, down, or horizontal)
- Sentiment – displays the current strength of the trend.
- Strong Uptrend
- Weak Uptrend
- Strong Downtrend
- Weak Downtrend
Tip: You can change the Label property of the column to describe what type of signal you choose to display.


