Introduction
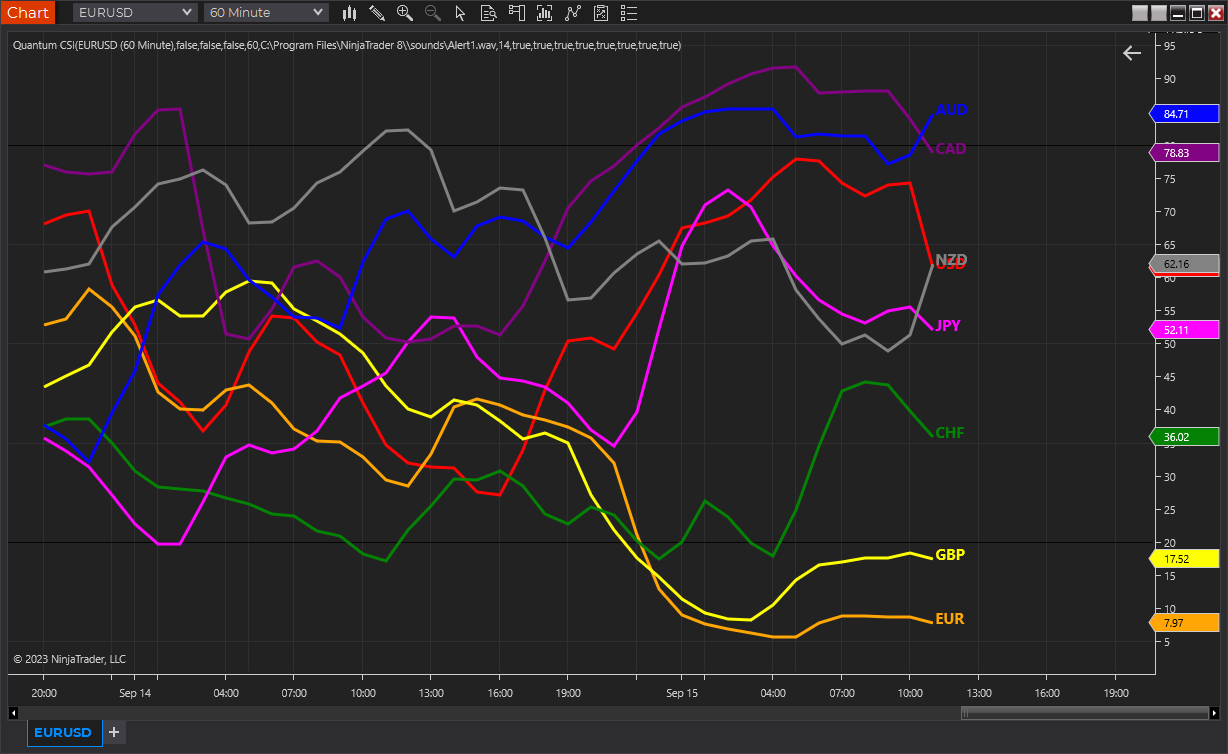
The Quantum Currency Strength indicator NinjaTrader 8 has been designed to show you easily and quickly when a currency is moving strongly in one direction or another, either to an oversold state, or to an overbought state. Currencies and currency pairs move constantly from one to the other in all timeframes.
These are the points at which a currency is likely to reverse and change trends. The overbought and oversold regions on the indicator are defined by the lines at 20 and 80, and once these regions are approached then this is a signal for further analysis on the chart. Using the Currency Strength Indicator on NinjaTrader 8 in multiple timeframes is an excellent way to see whether a currency is rising or falling across several timeframes, adding a further dimension to your analysis, and allowing you to quantify the risk on any trade in a more detailed way.
Whilst this indicator has been designed to show you when currencies are potentially overbought or oversold, the Quantum Currency Strength Indicator will also show you when currencies are in congestion phases as they meander and bunch together. Typically, this is seen ahead of major news releases as the currency markets pause and wait before the release. Currency Strength Indicator NinjaTrader 8
The indicator is your radar on the market, guiding you to those currency pairs which may be rising strongly or falling strongly, and just as important those pairs which are not moving at present.
Finally, the indicator will also help you monitor current positions, with the indicator showing you when a currency moved from one extreme to another and perhaps signaling a potential reversal in the opposite direction.
For best results, please use the Quantum Currency Strength Indicator (CSI) in a forex chart preferably one with high tick rate like EURUSD and other USD pairs. The indicator will work in all timeframes from seconds to minutes, hours and months on the NinjaTrader 8 platform.
When you first apply the indicator, please allow a few seconds for the data to build in history.
The lines at the top and bottom of the indicator (80 at the top and 20 at the bottom) are not designed as an entry or exit signal. They are simply there to give a guide as to when a currency is approaching or moving into an oversold or overbought region in that timeframe.
Currency lines
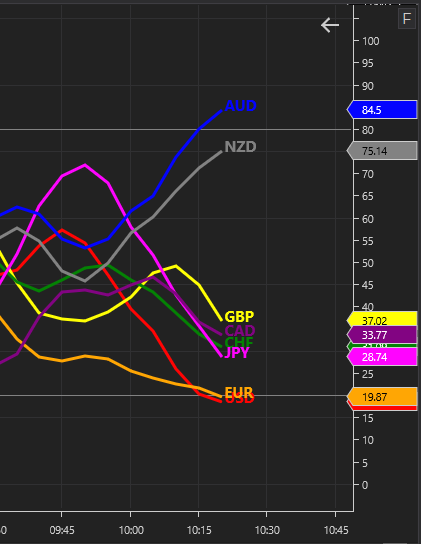
Each currency is represented by a line which is color coded as follows:
- US Dollar – Red
- Euro – Orange
- British Pound – Yellow
- Swiss Franc – Green
- Japanese Yen – Magenta
- Canadian Dollar – Purple
- Australian Dollar – Blue
- New Zealand Dollar – Grey
To identify each line easily, you can use as reference the colored currency labels at the left-hand side of the chart. These labels can also be used to display or hide the currency they represent.
Currency Dashboard
By itself, the Quantum Currency Strength Indicator is a powerful trading tool for identifying trading opportunities quickly and easily on a single chart. However, its development is part of a new indicator bundle that we like to call the Quantum Currency Dashboard which consists of the following indicators:
- Quantum Currency Strength Indicator (CSI)
- Quantum Currency Matrix
- Quantum Currency Array
- Quantum Currency Heatmap
These four indicators provide a unique and compact insight into all the various aspects of strength and weakness for both currencies and currency pairs from trend and momentum to overbought and oversold. What is unique is that using four charts you are then able to monitor the myriad combinations of strength, weakness, momentum, congestion and divergence across the entire forex complex at a click of a button. And even more powerfully giving you the confidence to get in and stain for maximum profits. No more missed opportunities, no more struggling with multiple charts, and no more trader regret whatever your trading style approach.
Installation
Open your NinjaTrader 8 platform and select a chart.
Right click the chart to bring up a menu which looks like the following image:
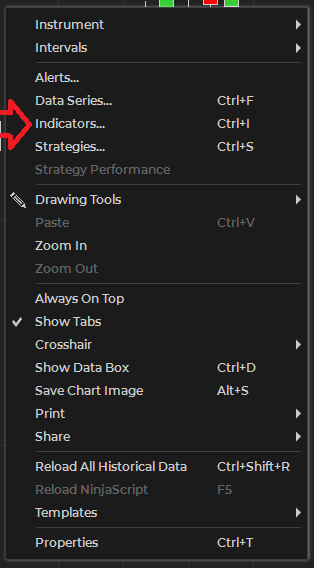
Select Indicators… which will open the following window. Alternatively, you can open this window by clicking the Indicators button in the chart toolbar or by pressing Ctrl + I while focused on the chart.
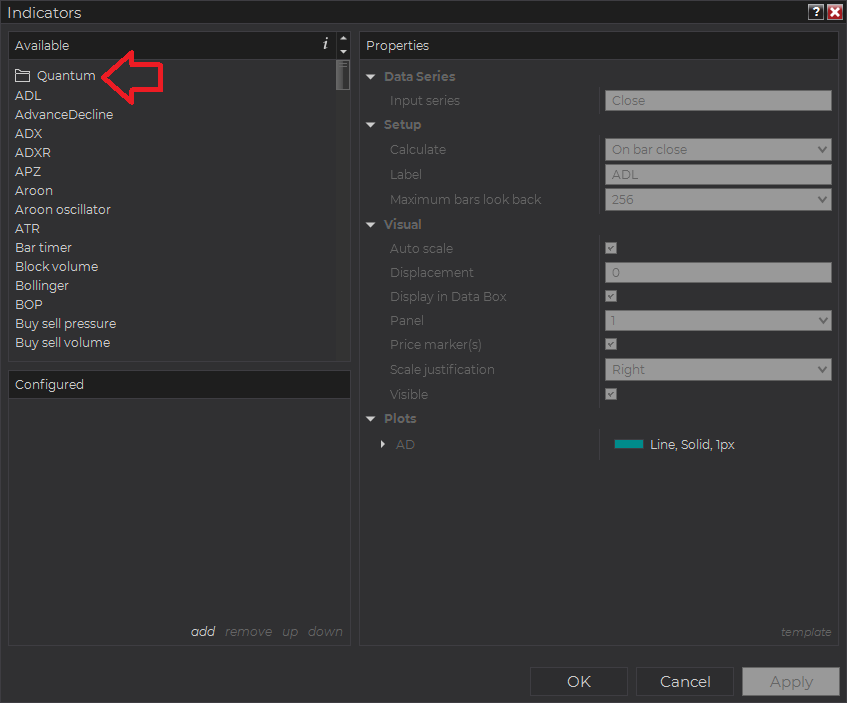
In the Indicators window under Available section, go to Quantum > Quantum CSI and click it to select the indicator. Once selected, click “add” under the Configured section which will put it on the list of active indicators to be added in the chart.
Before clicking the OK or Apply button to complete, the indicator has several configurable options. You can click the Apply button at any time, and this will apply any changes you have made to the indicator without closing the window. This will allow you to see the changes you have made to the indicator, without closing with the OK button or the Cancel button.
Configuration
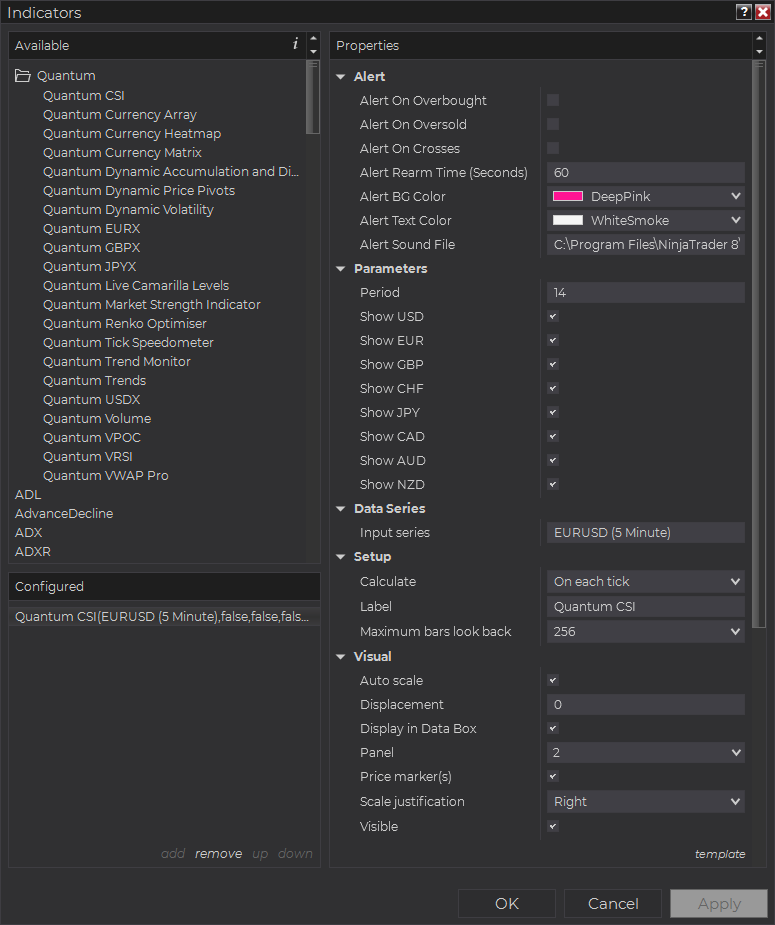
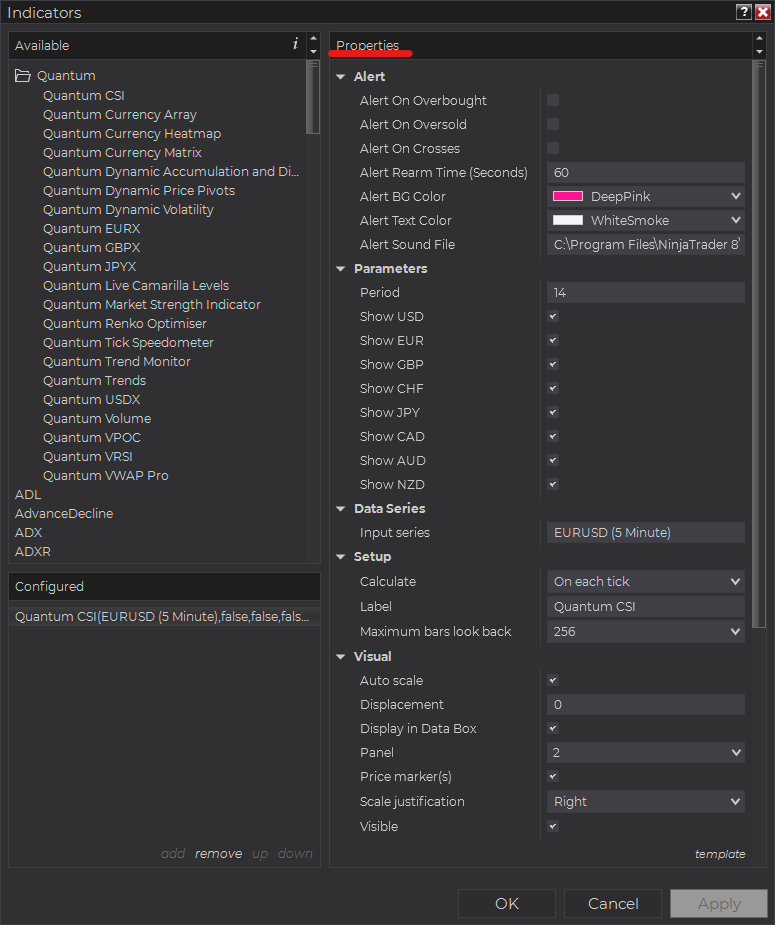
All user input can be configured at the right-hand side of the Indicators window under the Properties section. These are the default settings when you add the indicator in a chart.
Main Settings
Alert
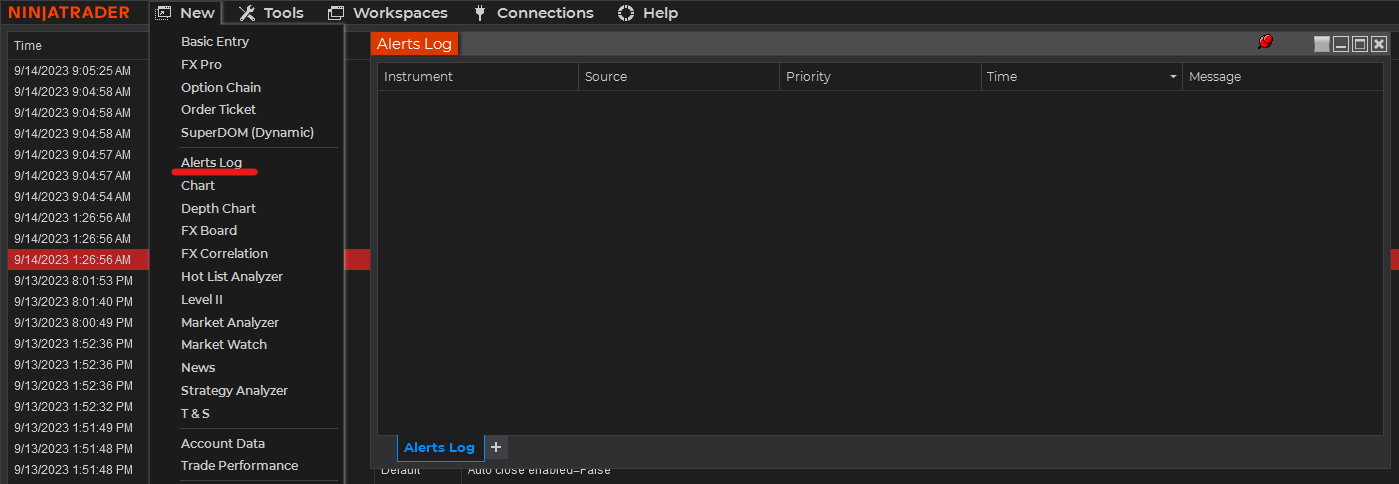
The following settings affect the indicator’s alert notifications displayed in the Alerts Log. You can open the Alerts Log from your NinjaTrader 8 client’s menu bar in the main window at New > Alerts Log.
Alert On Overbought
When enabled, the indicator sends an alert notification in the Alerts Log when one or more currencies enter the Overbought level.
Alert On Oversold
When enabled, the indicator sends an alert notification in the Alerts Log when one or more currencies enter the Oversold level.
Alert On Crosses
When enabled, the indicator sends an alert notification in the Alerts Log when one or more pair of currencies cross paths anywhere in the oscillator.
Alert Rearm Time (Seconds)
This adds a delay to the next alert notification, expressed in number of seconds.
Alert BG Color
This setting allows you to customize the background color of the indicator’s messages as they appear in the Alerts Log.
Alert Text Color
This setting allows you to customize the color of the text as the indicator’s messages appear in the Alerts Log.
Alert Sound File
You can change here the sound file the platform uses when this indicator triggers an alert. By default, it uses the Alert1.wav file packaged with your NinjaTrader installation. Please make sure that the file is supported and the absolute path to the sound file is entered correctly.
Parameters
Period
This sets the look back period or the number of bars the CSI uses to calculate the strength of each currency within the duration.
Show USD
Shows or hides the USD line in the CSI.
Show EUR
Shows or hides the EUR line in the CSI.
Show GBP
Shows or hides the GBP line in the CSI.
Show CHF
Shows or hides the CHF line in the CSI.
Show JPY
Shows or hides the JPY line in the CSI.
Show CAD
Shows or hides the CAD line in the CSI.
Show AUD
Shows or hides the AUD line in the CSI.
Show NZD
Shows or hides the NZD line in the CSI.
Other Settings
Data Series
Input Series
Opens the indicator Input Series dialogue which allows you to select the source of data for your indicator’s calculations.
Setup
Calculate
Sets the frequency at which the indicator performs its calculations.
Label
The label of the indicator’s instance displayed on the chart.
Maximum bars look back
Determines the maximum number of bars the indicator can look back to perform calculations on historical data. This is set to 256 by default (the most memory-friendly setting), but it can be changed to “infinite” to allow for a greater look back period.
Visual
Auto scale
When enabled, the indicator will be included in the chart panel’s vertical automatic scaling.
Displacement
Sets the number of bars by which to displace the indicator plots.
Display in Data Box
Enables or disables the inclusion of the indicator’s plot values in the Data Box
Panel
Sets the panel in which the indicator is plotted. If you select “Same as input series,” the indicator will be linked to the Input Series and automatically move if the Input Series is modified to a different panel.
Price marker(s)
When enabled, the indicator value is plotted in the axis selected under the “Scale Justification” property.
Scale justification
Sets the scale on which the indicator will be plotted. Possible values are “Right,” “Left,” and “Overlay”.
Visible
Enables or disables visibility and function of the indicator on the chart.
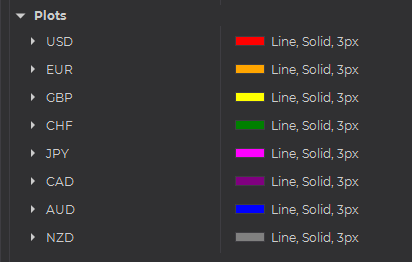
Plots & Lines
Sets a variety of parameters, such as color, for the plots drawn by the indicator.
- Overbought
- Oversold
- USD
- EUR
- GBP
- CHF
- JPY
- CAD
- AUD
- NZD
Unloading the indicator
Here are the steps to remove the indicator in the chart.
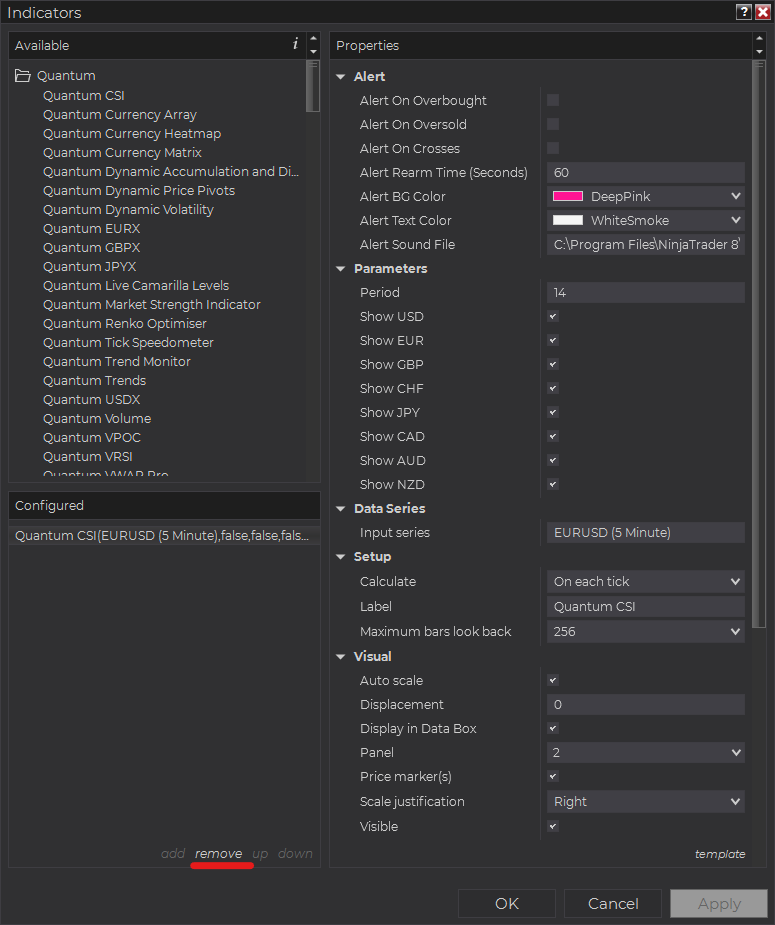
Right-click on the chart then select Indicators… from the menu. Select Quantum CSI from the Configured section and click OK to confirm and the indicator should be unloaded from your chart.
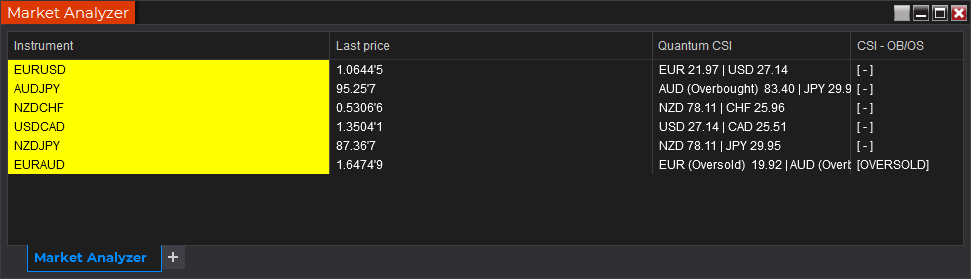
Using the Quantum Currency Strength Indicator (CSI) in the NinjaTrader Market Analyzer
Valid Rows
The Quantum CSI focuses on forex and can be used in a specific set of instruments only. The row instrument must be one of the 28 currency pairs from the combinations of the 8 major currencies in the Quantum CSI (USD, EUR, GBP, CHF, JPY, CAD, AUD, NZD).
Adding the Quantum CSI as a Market Analyzer Column
Here are the basic steps to add the Quantum CSI in the Market Analyzer:
Make sure valid rows are present in the Market Analyzer window.
Right-click anywhere in the Market Analyzer window then select “Columns…” in the context menu.
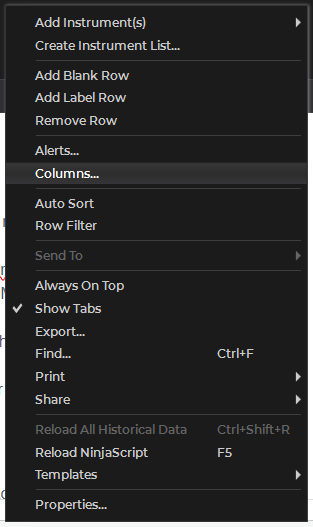
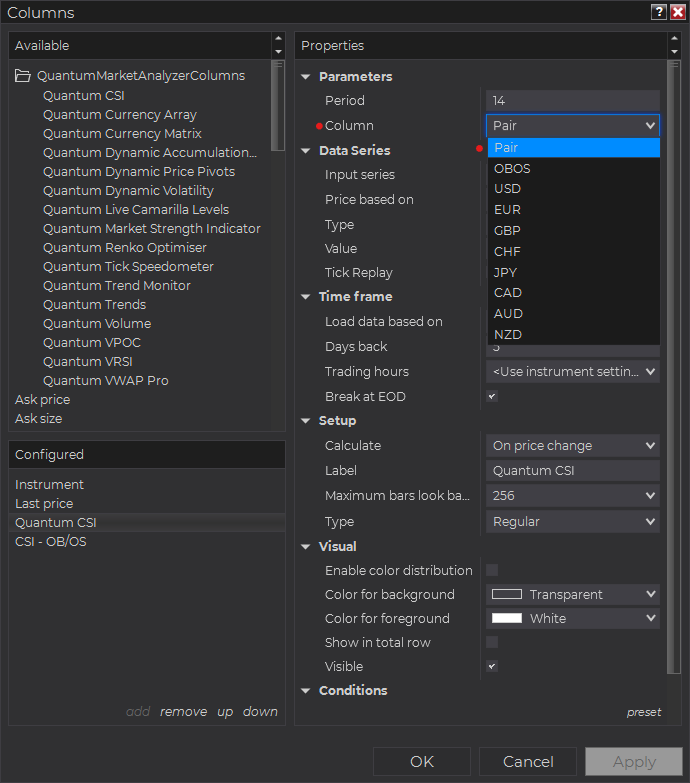
The Columns window appears. In the Available section, go to QuantumMarketAnalyzerColumns folder then double-click the Quantum CSI to add the indicator as one of the columns in the Market Analyzer.
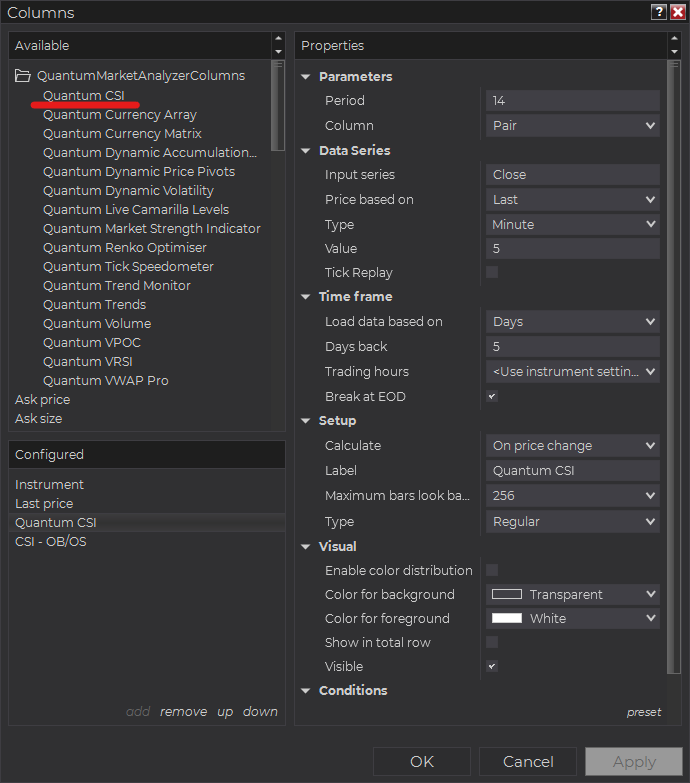
Select the type of information you like to display using the Column drop down menu under the Properties section of the indicator.
Set the timeframe of the indicator in Properties > Data Series section with the following user inputs:
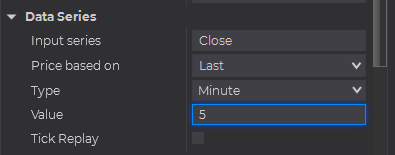
Type – select a time-based series such as Minute or Day
Value – set the interval for the type of series selected above
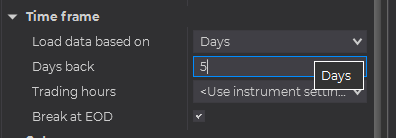
When running the indicator in timeframes less than Hourly intervals, please configure the “Load data based on” property to “Days” and the “Days back” property to the default value of 5 days to ensure that there is enough data for the indicator to work with.
After you have finished all your configurations, click OK to confirm your chosen settings and to add the indicator as a column in your Market Analyzer window.
Column Options
The Quantum CSI is a multi-faceted indicator that can display different types of signals which can be selected through its Column drop down menu found under the Properties section. You can customize the indicator’s function in the Market Analyzer by selecting any of the options enumerated below.
- Pair column – displays the current CSI value of the base currency and quote currency together in one cell.
- OBOS column – displays whether the pair is OVERBOUGHT or OVERSOLD. This happens when each side of the pair (base and quote currency) is Overbought and Oversold respectively or vice versa.
- USD column – displays the current CSI value of the USD currency.
- EUR column – displays the current CSI value of the EUR currency.
- GBP column – displays the current CSI value of the GBP currency.
- CHF column – displays the current CSI value of the CHF currency.
- JPY column – displays the current CSI value of the JPY currency.
- CAD column – displays the current CSI value of the CAD currency.
- AUD column – displays the current CSI value of the AUD currency.
- NZD column – displays the current CSI value of the NZD currency.
Tip: You can change the Label property of the column to describe what type of signal you choose to display.


