General – getting started
Many forex traders have either been told, or have learnt from painful experience, that the yen currency pairs can be both dangerous and volatile to trade. The GBP/JPY is perhaps the most infamous and volatile of all. No wonder then, that many forex traders simply stay away from the yen currency pairs. But then they probably don’t have a very clear idea of where the yen itself is heading. If they did, then trading the yen pairs would be much more straightforward. And even if you are trading other markets, such as index futures or stocks, having a view of the Japanese yen is crucial, given its characteristic of being a safe haven currency.
And this is where the Quantum JPYX indicator for NinjaTrader 8 steps in. It has been designed to give you the ‘heads up’ on where the Japanese yen is heading next, against a basket of four currencies. The index is then constructed using an equal weighting of 25% as follows:
- Euro
- US Dollar
- Australian Dollar
- New Zealand Dollar
The indicator can be used in one of three ways:
- First, to identify and confirm strength and weakness in major and cross currency yen pairs, helping you get in, stay in and get out
- Second, as a confirming indicator for the Quantum Currency Strength indicator, providing a perspective against other currencies
- Finally, as a barometer of risk particularly when viewed through the prism of related markets, such as equities
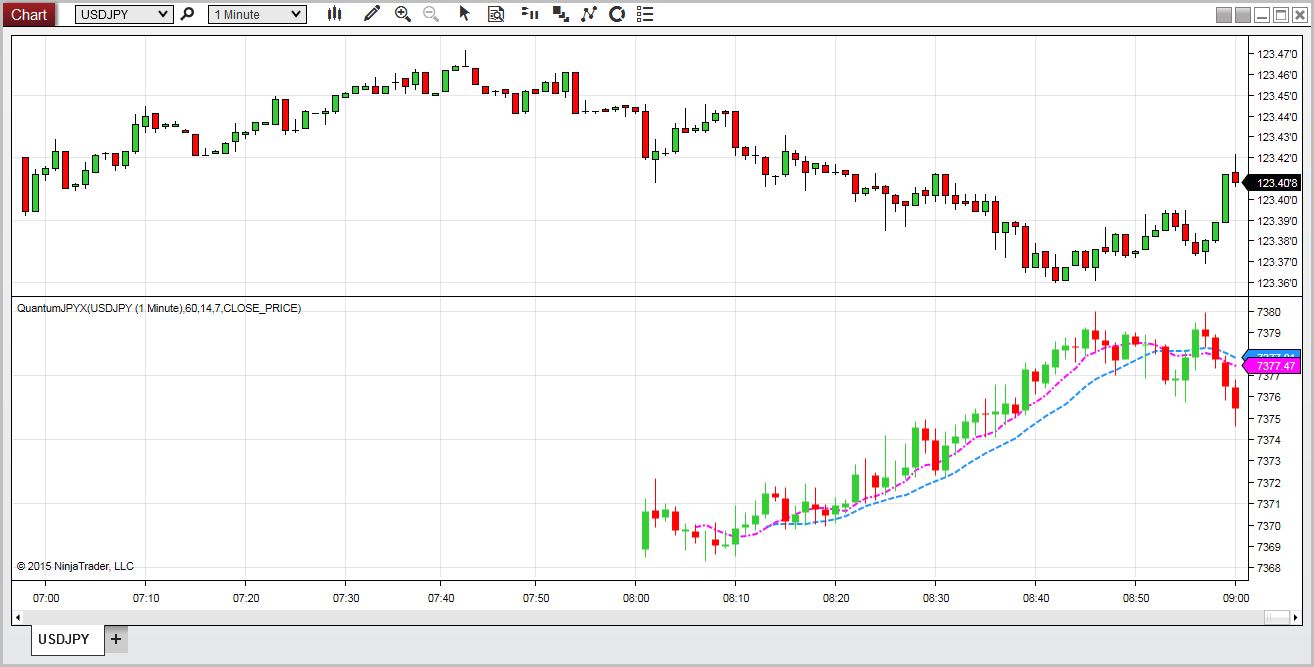
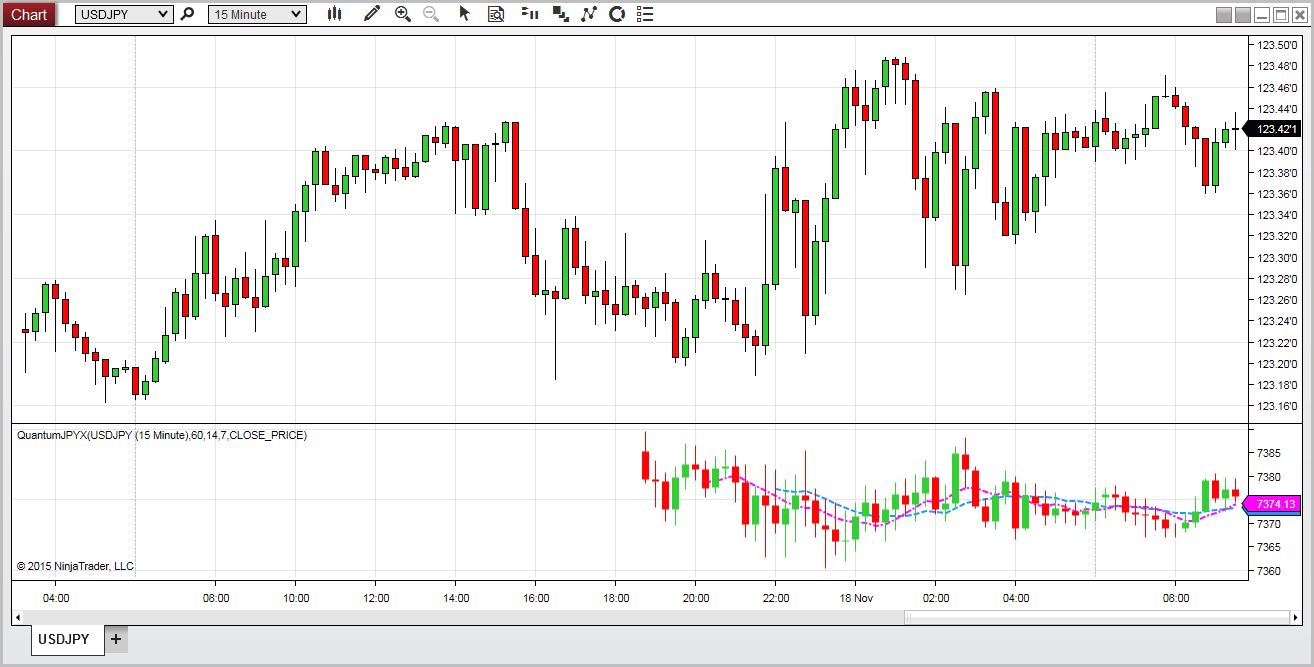
Best of all, you can simply attach to the bottom of your chart, and never have to leave your NinjaTrader account. The indicator plots the yen’s strength or weakness as a candlestick chart, supported by two simple moving averages.
For an even more forensic view of the yen, why not combine it with the Quantum Currency Strength indicator for Ninjatrader 8? Now you can trade the yen currency pairs with complete confidence, growing your trading account quickly, but with confidence!
Installation
Open your NinjaTrader 8 platform and select a chart. We recommend that you choose a fast-loading chart, such as a spot currency major.
Right-click the chart to bring up a menu which looks like the following image:
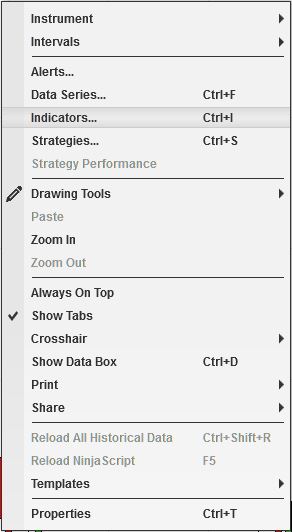
Select Indicators… which will open the following window. (Alternatively, you can open this window by clicking the Indicators button in the chart toolbar or by pressing Ctrl + I while focused on the chart.)
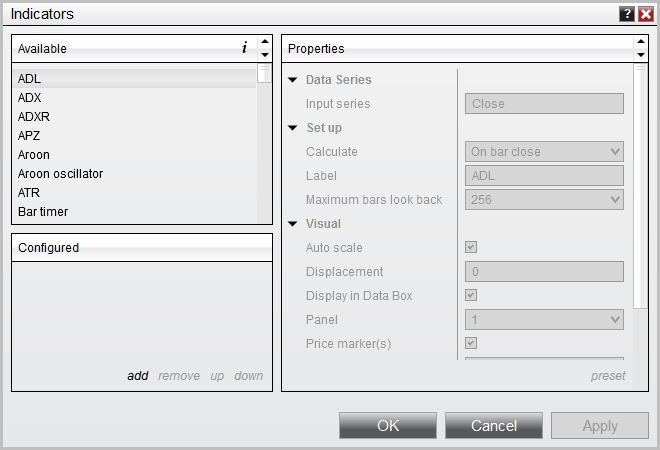
In the Indicators window, scroll down to the QuantumJPYX indicator and click it to select the indicator. Once selected, click add in the Configured frame which will put it on the list of active indicators to be added in the chart.
Before clicking the OK or Apply button to complete, the indicator can be configured in several different ways to suit your own personal preferences and trading style. You can click the Apply button at any time, and this will apply any changes you have made to the indicator without closing the window. This will allow you to see the changes you have made, and to modify again before closing with the OK button, or the Cancel button.
Limitations
Due to the way data is delivered to the platform, the Quantum JPYX indicator is limited to work only in time data series charts namely:
- Second,
- Minute,
- Day,
- Week,
- Month, and
- Year
If for some reason you attach the indicator to a chart other than the above data series, the indicator window will appear blank with a message at the bottom right hand corner as shown below:
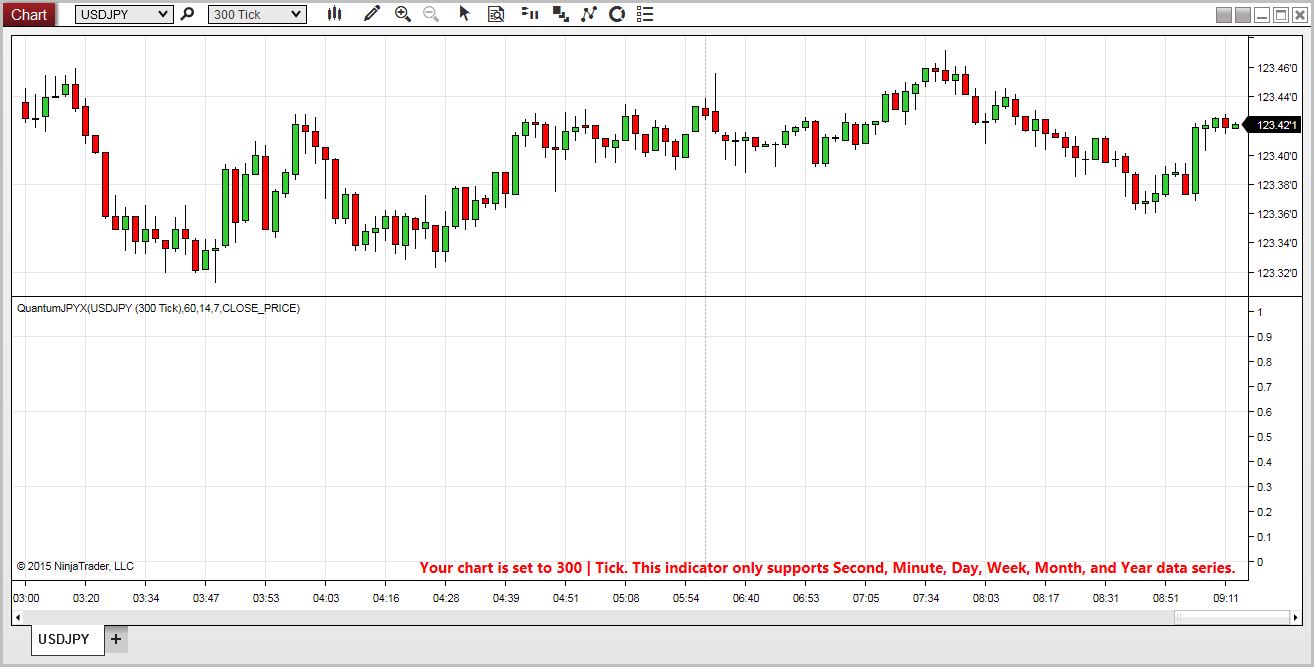
Simply revert back to any of the supported data series mentioned in the message to restore output.
Configuration
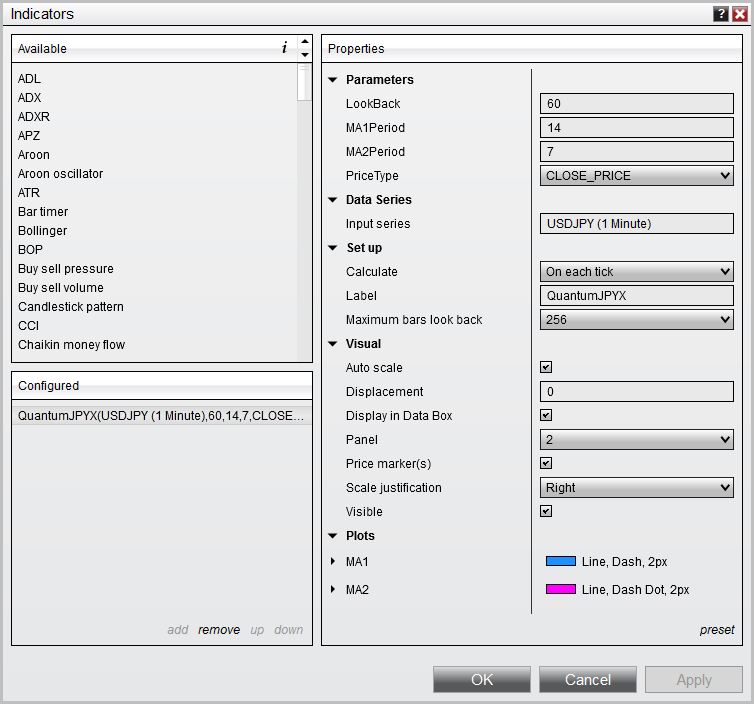
All of the user configuration is done on the right hand side of the above screen, which is shown enlarged below. These are the default settings when you first install the indicator to a chart.
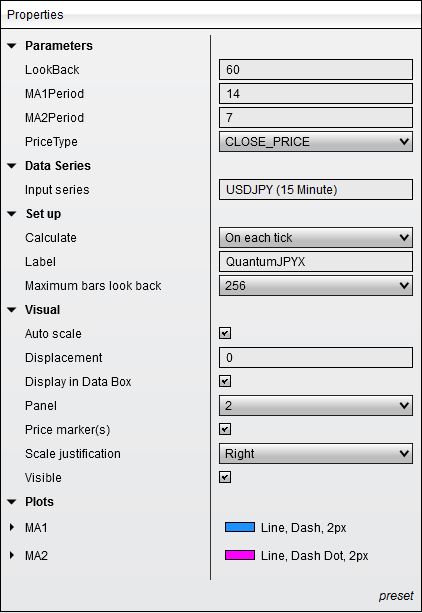
Parameters
LookBack – This parameter determines the number of bars the indicator displays, also as a way of conserving resources for slower machines.
MAPeriod1 – This is the period of one of the 2 simple moving averages delivered with the JPYX. It is set to 14 by default and is coloured blue. Though this is the slower moving average of the two, you are free to set this to any other timeframe to suit your own personal preference.
MAPeriod2 – This is the period of the second simple moving average. It is set to 7 by default and is coloured magenta. Though this is the faster moving average, again you are free to set this to any other timeframe to suit your own personal preference.
PriceType – This is the price type from which the 2 guiding moving averages are calculated. You can either choose OPEN_PRICE, HIGH_PRICE, LOW_PRICE, or CLOSE_PRICE. By default it is set to CLOSE_PRICE.
Data Series
Input series – This shows the timeframe for the indicator and will be displayed according to the chart time.
Set up
Calculate – Please do not change this setting and leave as the default of On each tick.
Label – This is the label which will display on the chart once the indicator is attached.
Maximum bars look back – This is the maximum number of bars in the look back for the indicator. We suggest you leave this as the default of 256 as it is memory friendly.
Visual
Auto Scale – Do not change this setting and leave this as the default of True (checked).
Displacement – Do not change this setting and leave this at the default of 0.
Display in Data Box – We suggest you leave this at the default of True (checked).
Panel – this specifies the panel number where the indicator will appear. We suggest you leave this as the default of 2.
Price Marker(s) – Please do not alter this setting and leave as the default of True (checked).
Scale Justification – Please do not alter this setting and leave as the default of Right.
Visible – this shows or hides the plots of the indicator. Please leave it checked to make the indicator visible.
Plots
This is where you can change various properties of the indicator’s plots:
- MA1 – the plot for the first moving average
- MA2 – the plot for the second moving average
A list of plot styles or properties will be shown to you by clicking the arrow graphic beside the plot for you to customize the appearance of the plot to your liking:
- Color – the default for MA1 is DodgerBlue while the default for MA2 is Magenta
- Dash style – the default for MA1 is Dash while the default for MA2 is Dash Dot
- Plot style – the default for both plots is Line
- Width – the default for both plots is 2
Once you have made any changes to the settings for the JPYX indicator, left click the OK button to complete and update the indicator.
Resizing the indicator
When you first apply the Quantum JPYX indicator to the chart the indicator window may need resizing, and below is an example of how the indicator may look with no option changes applied and the default white background of a NinjaTrader chart.
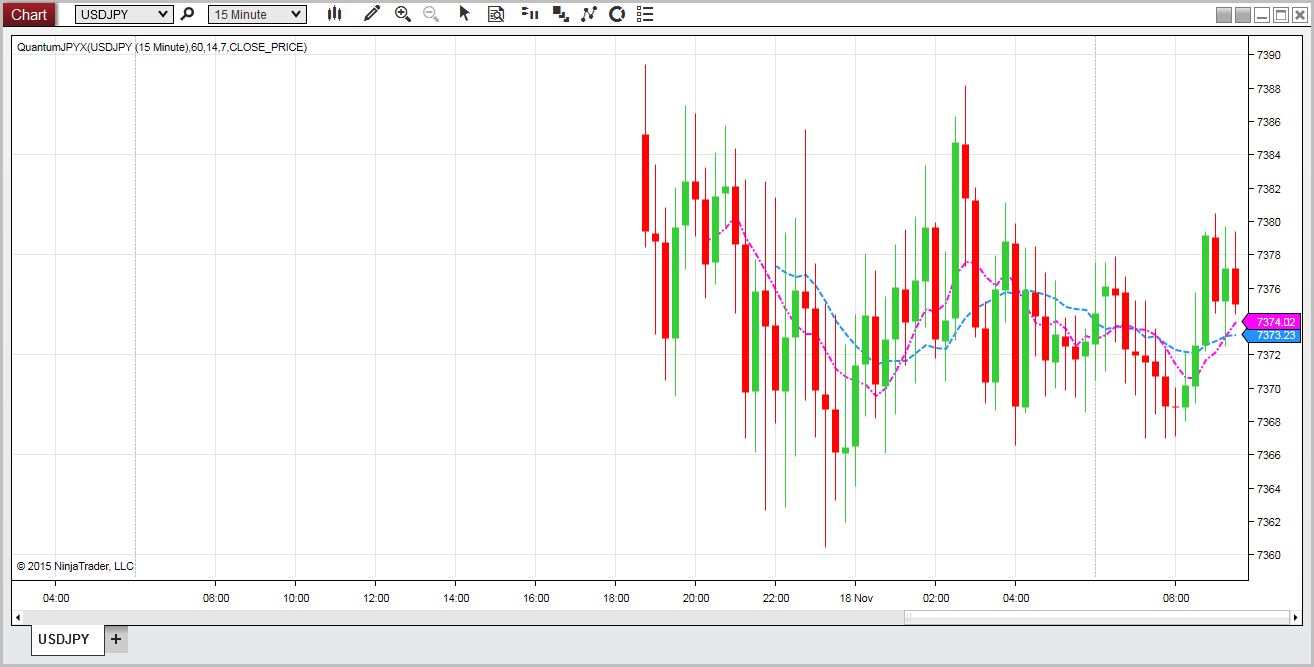
In order to resize the indicator to the maximum height, hover over the horizontal line which separates the chart from the indicator, and you will see a small icon displayed of a solid black line with an arrow above and below. Once this appears, then left click HOLD and drag to resize the indicator window. Your Quantum JPYX indicator will then look like this:
Removing an indicator
These are the steps to remove an indicator from a chart:
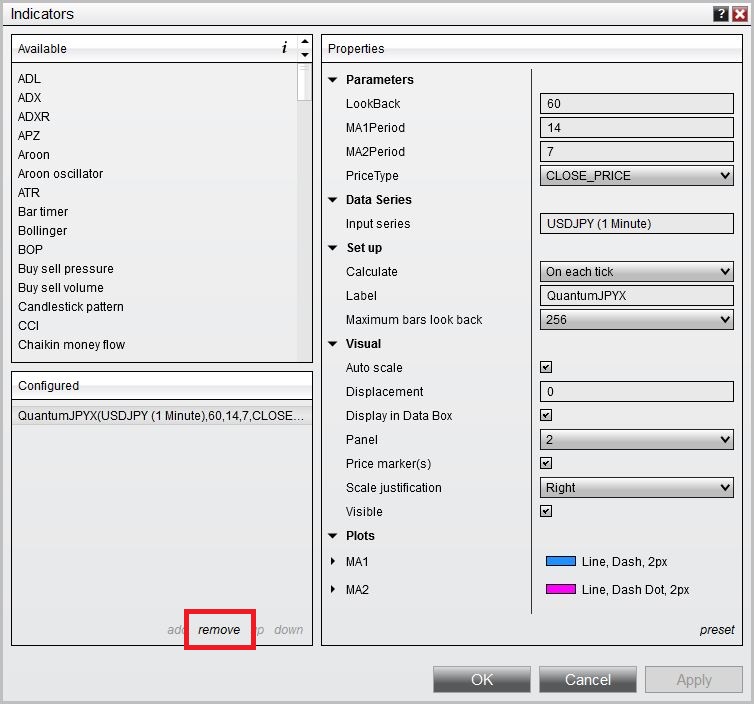
Right click on the chart then select Indicators from the menu. Select QuantumJPYX from the Configured frame and click remove. Click OK to confirm and the indicator should be unloaded from your chart.


