General – Getting Started
Renko charts are one of the most popular Japanese charting techniques and there are several reasons for this and why we developed the renko optimiser indicator for NinjaTrader.
First it allows traders to focus solely on price as the chart filters out all minor price fluctuations and market ‘noise’.
This makes it easier for traders not only to identify strong moves, but also to spot significant turning points, and so allow traders to deploy smarter entries and exits.
Second, a renko chart then helps traders in what is probably one of the most difficult aspects of trading, namely staying in a position once a move is underway. The Renko chart does this by displaying price momentum as it accelerates and decelerates. And it does this because a renko chart is devoid of time.
And by ignoring time, renko charts focus solely on price moves that meet a pre-determined value, with the chart displaying price ‘bricks’ that represent this fixed price move. The bricks are drawn at 45-degree angles from each other and are usually based on the closing price for the input value. So for example if a brick is set to close once 10 pips, points or cents have gone through the market it will only do so once this value has completed.
However, there is one major disadvantage to a standard renko chart and that is traders have to manually input a value to the renko chart, and whilst experienced traders can develop a ‘feel’ for the optimum value, this can take time to develop.
After all, how do you choose the “right” value? Indeed what is the reasoning behind choosing a brick size, and is there a systematic way to pick a brick size for any situation?
And for traders who are new to the concept of Renko charts, it can be daunting and often is simply a ‘guess’ at what might be considered a ‘reasonable’ number of pips, points or cents.
And this is where the Quantum Trading Renko Optimizer indicator for NinjaTrader steps in, as it has been developed to offer traders all the advantages of using a renko chart with the added benefit the trader no longer has to worry about guessing the optimal setting for any instrument or market. The indicator delivers the optimal setting automatically.
So how does it work?
The Quantum Trading Renko Optimiser indicator for NinjaTrader offers a simple, effective, and systematic method in choosing the most effective brick size, and the best part of all – it’s all done with just the click of a button!
By using Average True Range the Renko Optimiser indicator starts by calculating the degree of volatility of the instrument within a given period and timeframe. You may already be familiar with ATR and by using the ATR to determine the brick size, we can eliminate the noise or volatility normally present in a candlestick chart. It is a popular technique used by traders with Renko charts but which is all automated by the Renko Optimiser indicator.
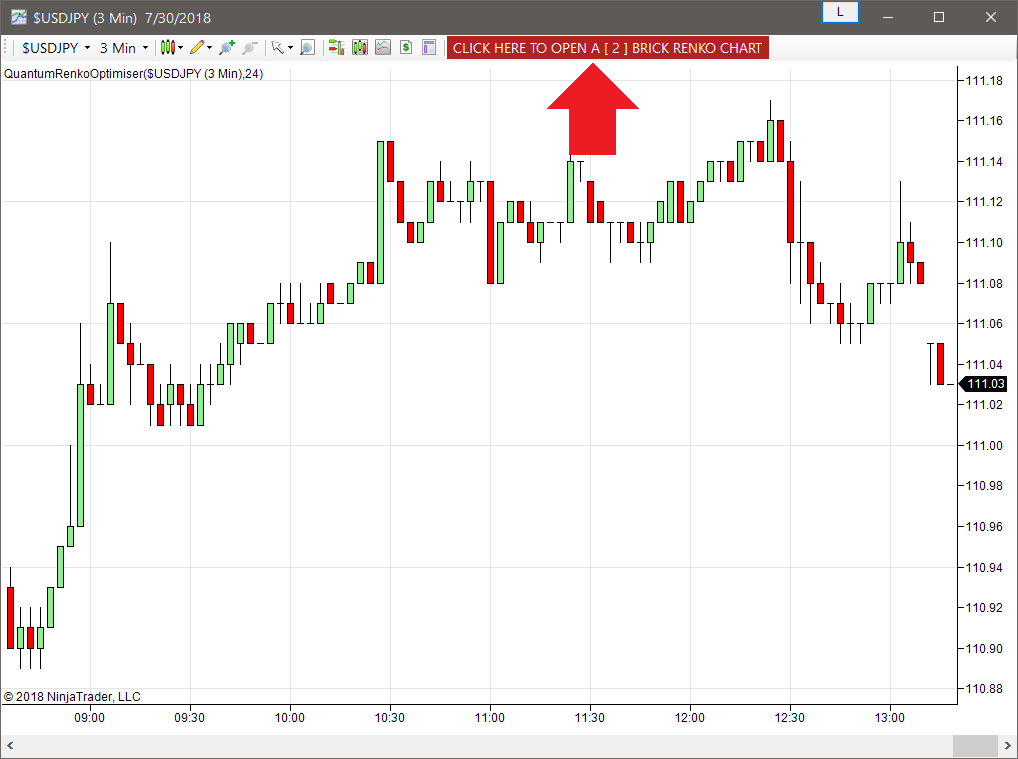
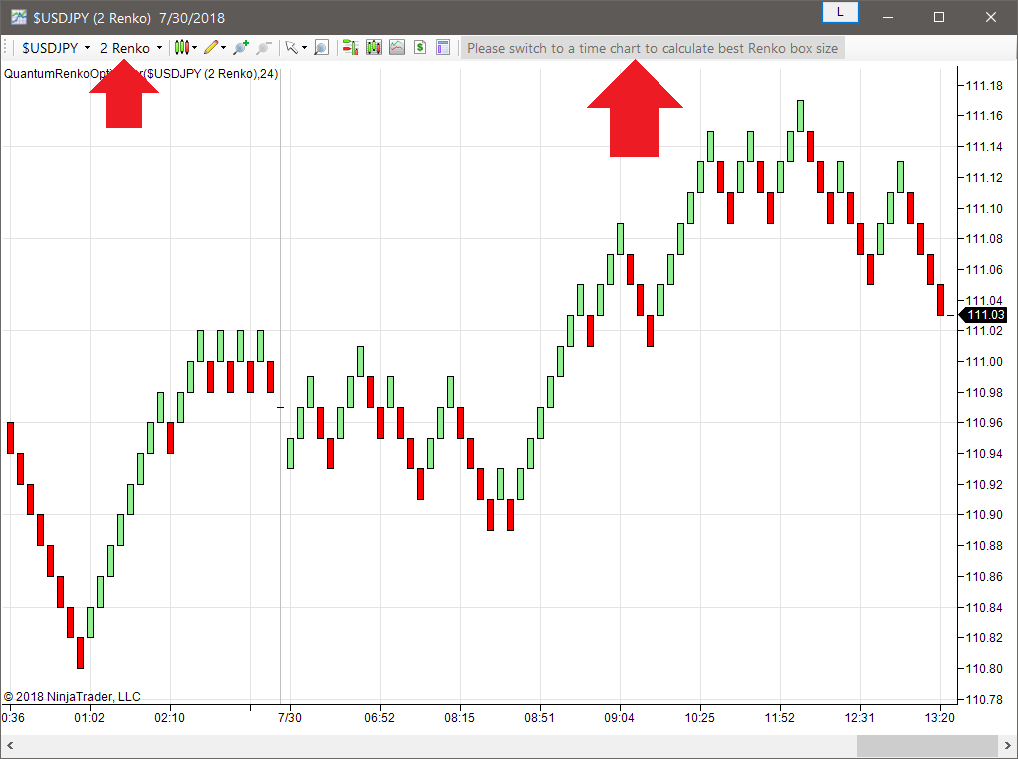
Everything is then encapsulated in a button conveniently located at the toolbar of the chart. This button displays the calculated best brick size for the current market and timeframe selected. By clicking the button, the indicator automatically reconfigures the current candlestick chart to switch to an optimized NinjaTrader Renko chart using the calculated brick size.
The Renko Optimiser indicator has been streamlined to bring you an intuitive trading experience when working with Renko charts in the NinjaTrader platform. You can start using it in 2 easy steps:
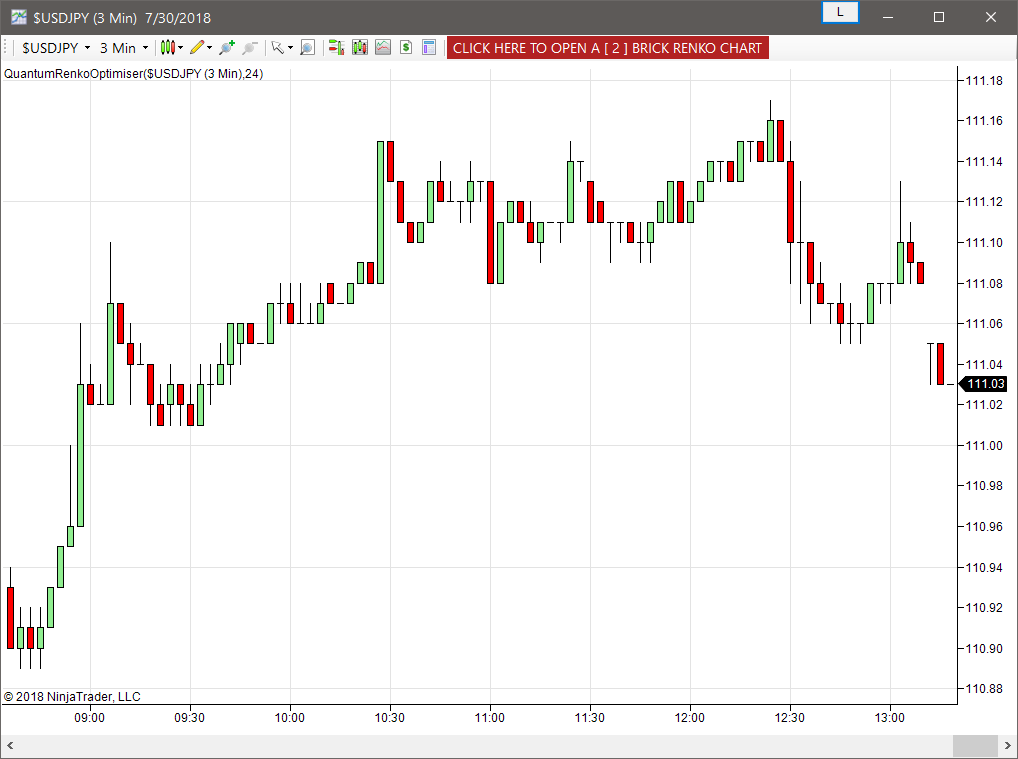
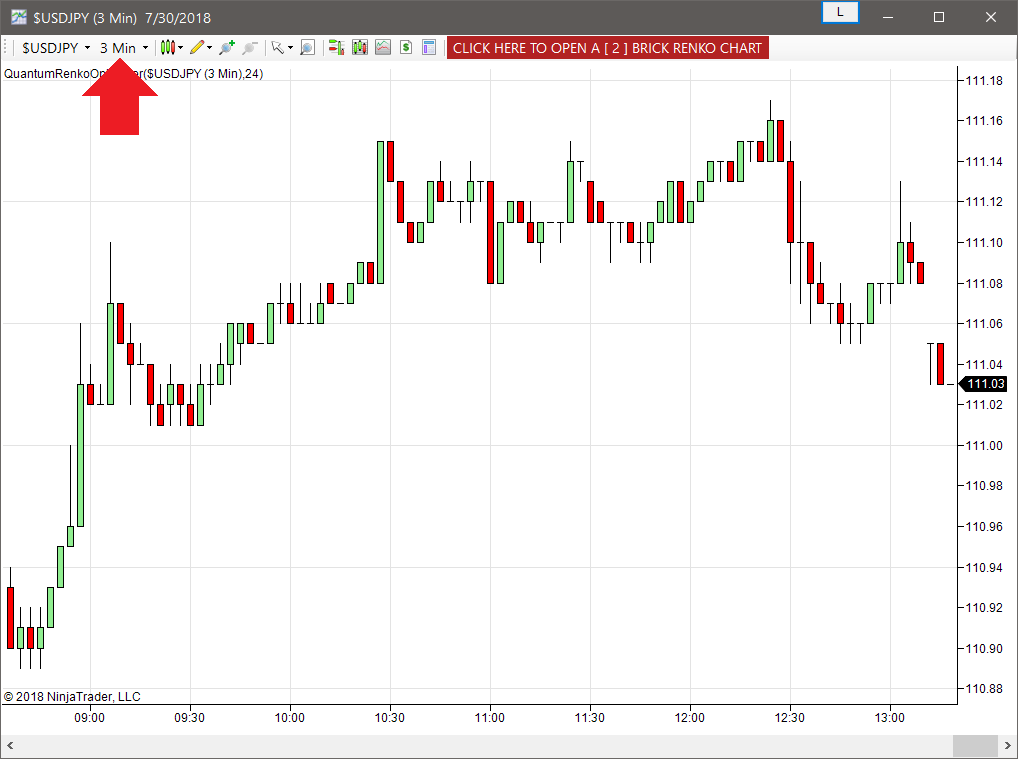
Step 1: Open a time chart of the instrument of your choice and apply the QuantumRenkoOptimiser. (Make sure that its Data Series is time-based. Example: 3 Minute)
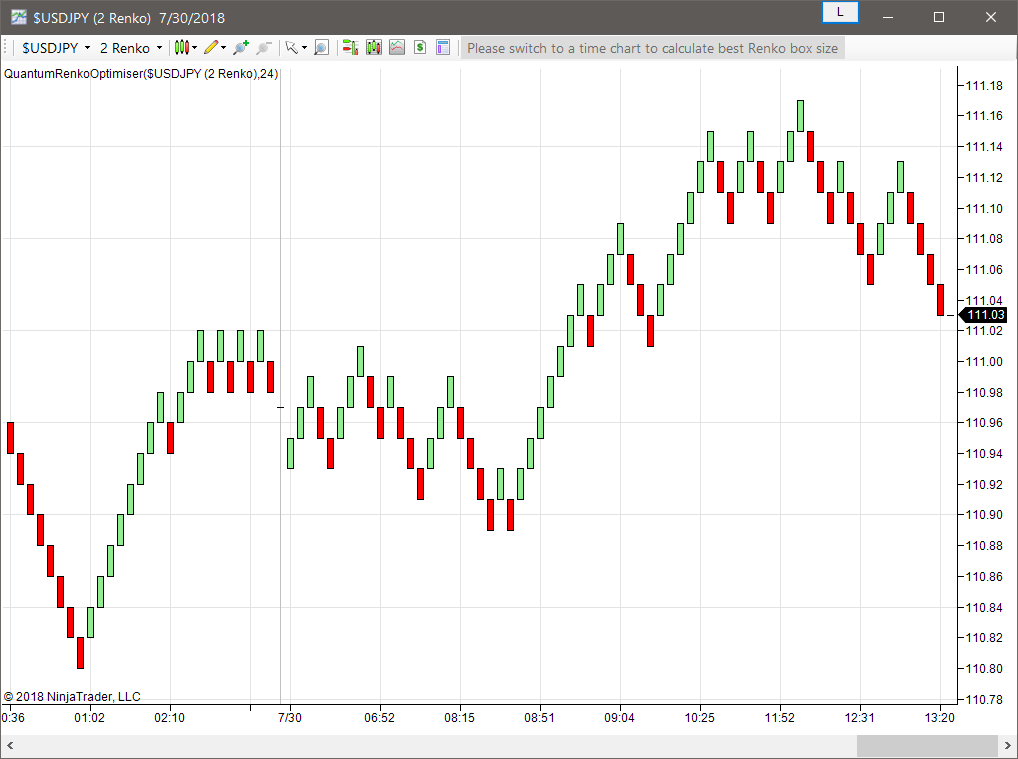
Step 2: When applied, the indicator calculates the best box size in the context of the current timeframe and displays it in a button located at the toolbar of the chart. Simply click this button to switch the chart to Renko with the current calculated best box size.
Please note that the button is disabled while the chart is in Renko mode. You can reactivate it by switching the chart back to a time-based Data Series.
Installation
Open your NinjaTrader platform and select a chart
- Right click – this will open the following window:
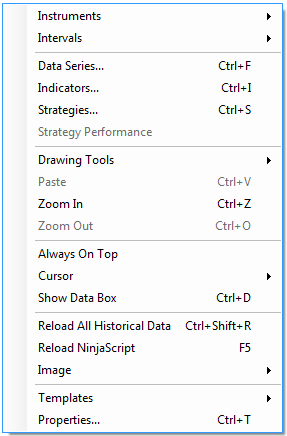
- Left click > Indicators
This will open the following window: (you can also open this window in another way by clicking on the Indicators icon in the NinjaTrader toolbar) 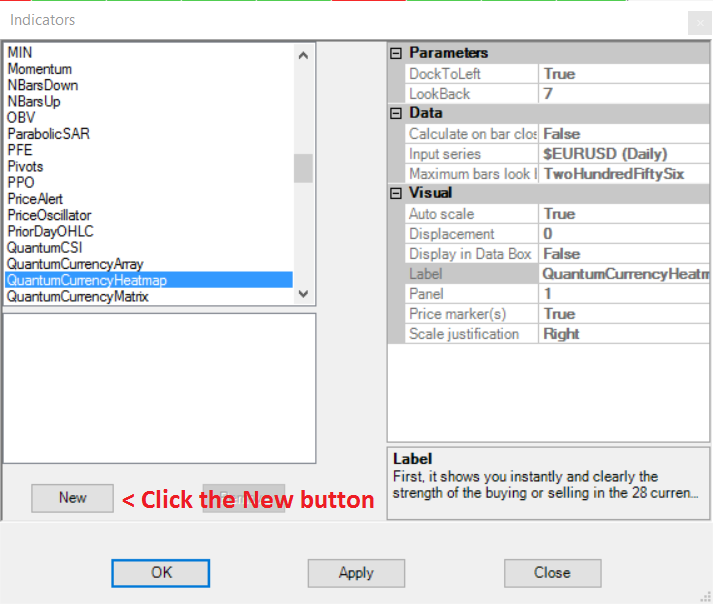
Scroll down to the QuantumRenkoOptimiser indicator:
- Left click > This will highlight the indicator in blue
- Left click > ‘New’ button as shown above
This will add the QuantumRenkoOptimiser indicator in the box below as shown here:
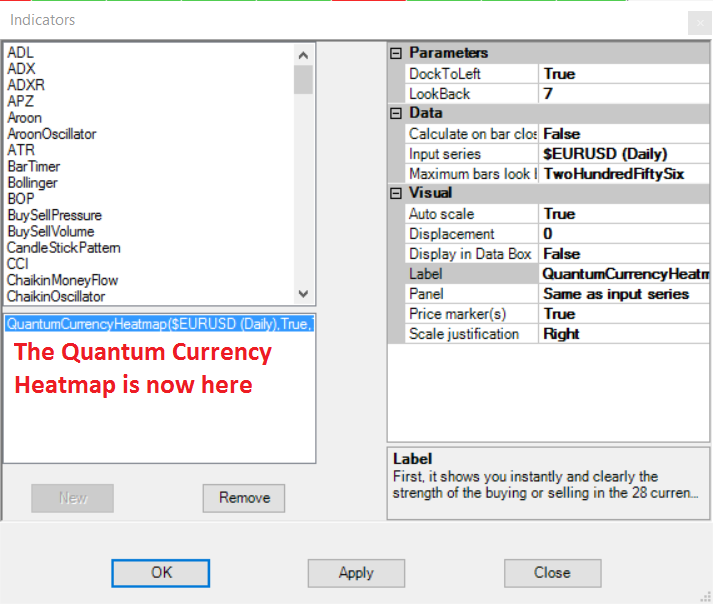
Before clicking the OK or Apply button to complete, the indicator has one or two options which can be configured. You can click the Apply button at any time, and this will apply any changes you have made to the indicator, without closing the window. This will allow you to see the changes you have made, and to modify again before closing with the OK button, or the Close button. All of the user configuration is done on the right hand side of the above screen, which is shown enlarged below. These are the default settings when you first install the indicator to a chart.
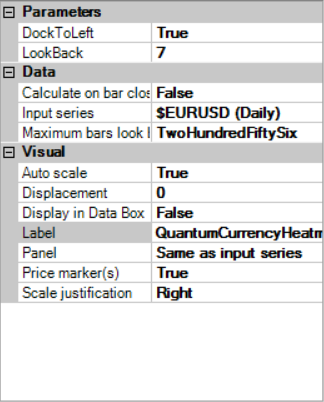
Parameters
ATRPeriod – Determines the number of bars the indicator will process to calculate the average true range. By default, it uses the last 24 bars of the instrument to calculate ATR but you can change it according to your preferences.
Data
These are the Data inputs:
Calculate on bar close – please DO NOT change this setting and leave as the default of False Input series – this shows the timeframe for the indicator and will be displayed according to the chart time. In this case the indicator was attached to a EURUSD 5min chart
Maximum bars look back – this is the maximum number of bars in the look back for the indicator. We suggest you leave this as the default of TwoHundredFiftySix as it is memory friendly
Visual
These are the Visual inputs:
Auto Scale – DO NOT change this setting and leave this as the default of True
Displacement – DO NOT change this setting and leave this at the default of 0
Display in Data Box – we suggest you leave this at the default of False
Label – this is the label which will display on the chart once the indicator is attached. You can remove this if you wish as follows:
- Place your mouse on the Label label, and left click. This will highlight Label in blue. Left click in the value field alongside and your cursor will appear. Delete the text using the back button and when you apply the indicator, the text will no longer be displayed
Panel – please DO NOT alter this setting
Price Marker(s) – please DO NOT alter this setting and leave as the default of True Scale
Justification – please DO NOT alter this setting and leave as the default of Right
Removing an indicator
These are the steps to remove an indicator from a chart: Right click on the chart and then left click on Indicators from the pop up menu. Scroll down to the indicator you wish to remove and left click which will turn the indicator blue. This will then display the indicator window with its settings as shown below:
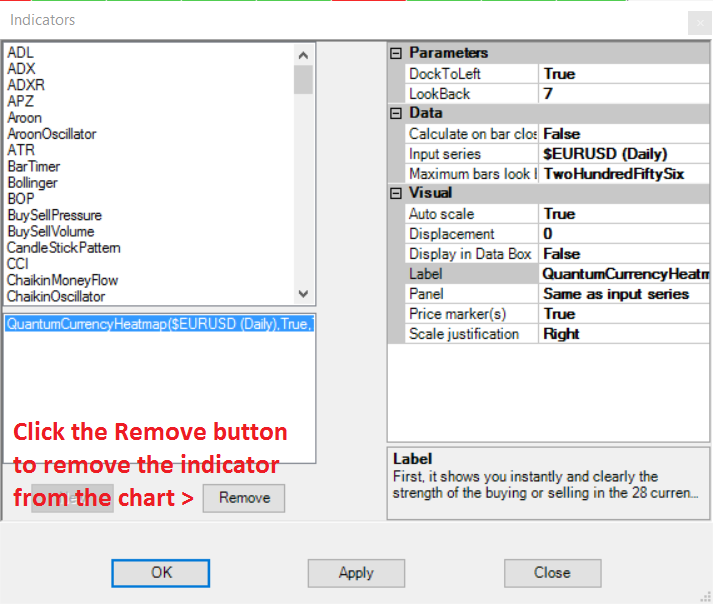
Simply left click on the Remove button as shown above, and the indicator will disappear from the list of indicators on the chart. To confirm left click the OK button to confirm and close the window.


