
Description
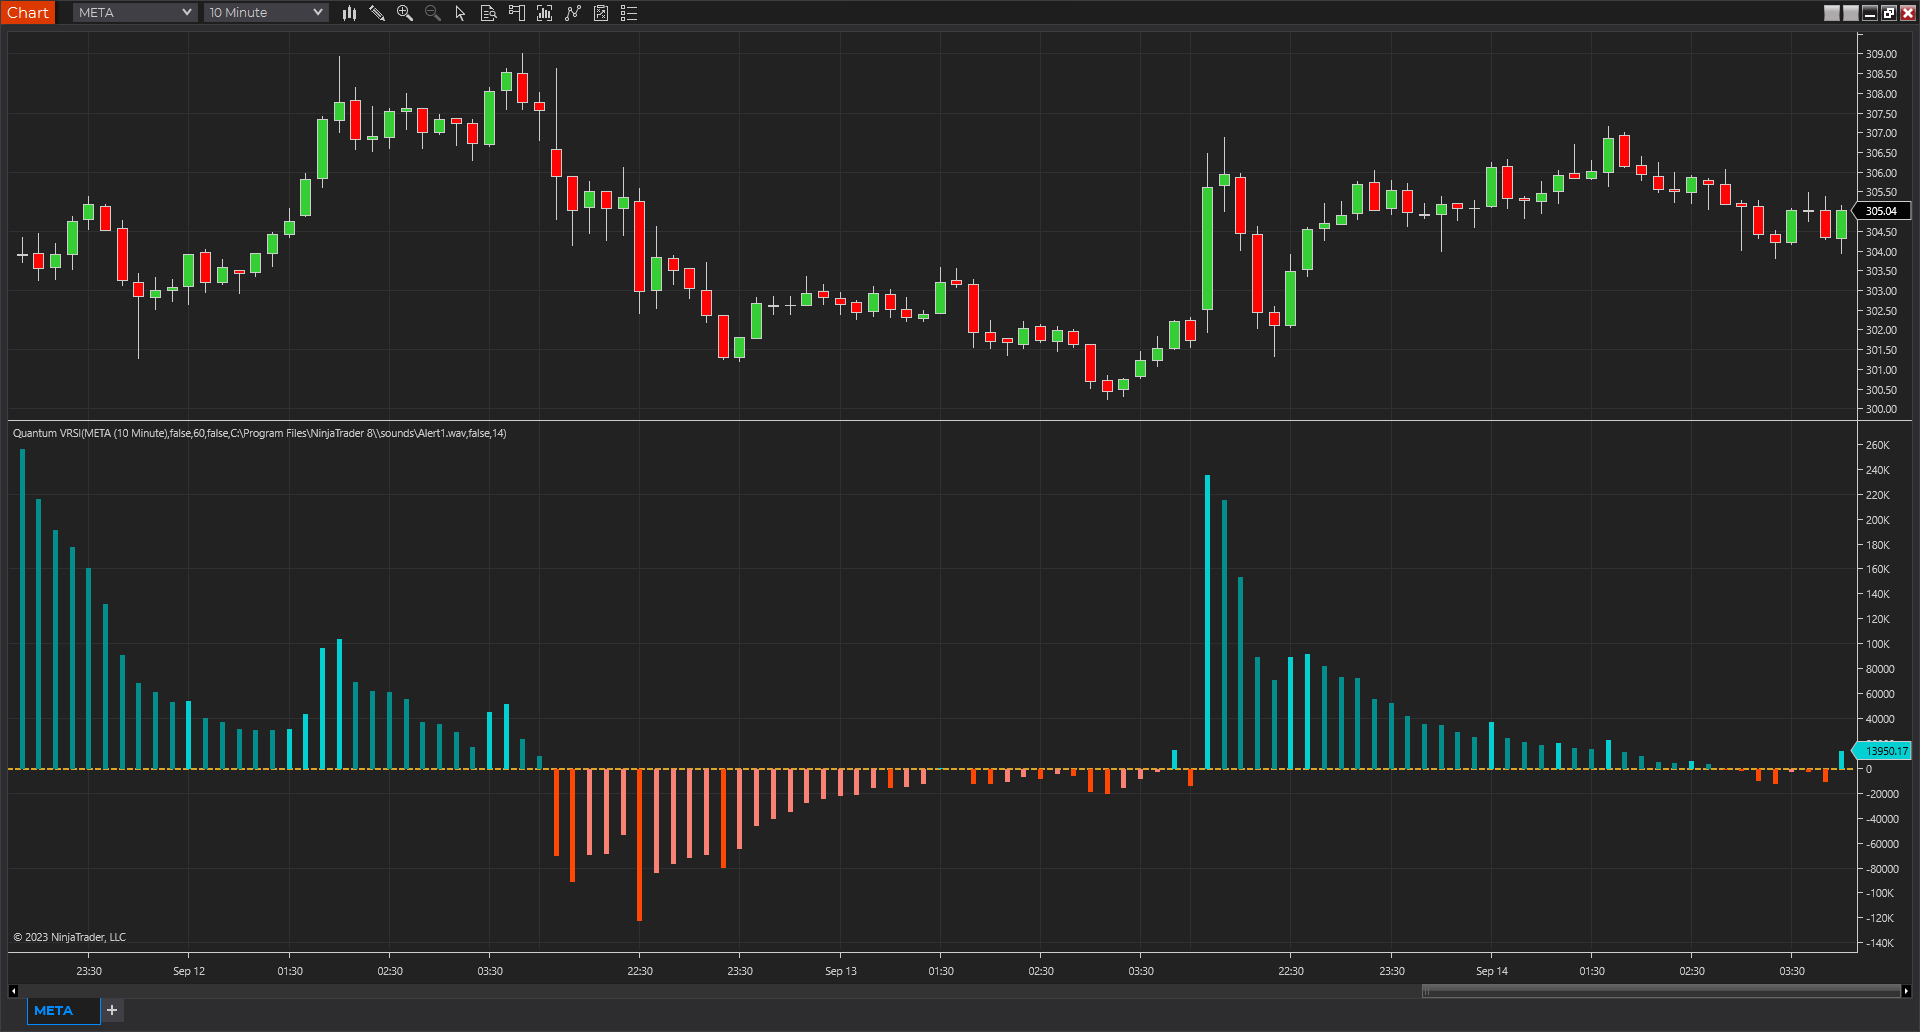
The VRSI indicator is another in the suite of volume indicators we have developed and one that complements our volume price analysis methodology perfectly. and was developed out of a desire to build further on our cornerstone of VPA by peeling back the layers of volume and considering the relative aspect of volume. Hence, the acronym of Volume Relative Strength Index indicator encapsulates what the indicator is all about.
By analyzing relative volume, we are able to see a visual representation of the pressure in a trend, or indeed the lack of pressure, and in doing so, present in a clear, intuitive, and colorful way whether the trend we are trading or considering joining is being driven with constant or rising pressure as it develops whether higher or lower. If so, the indicator gives us that all-important ingredient: confidence—namely, the confidence to continue maintaining the position for as long as possible. However, equally important is when we see a trend that is tiring, with falling pressure, sending a strong signal it is time to close out. Alternatively, when there is little or no pressure in the trend, this is a signal to wait and be patient.
These signals are delivered in a variety of ways, primarily through a color change sequence of brighter or darker colors, but equally importantly, based on the height of each pressure bar and its relationship to its neighbor or groups of bars. And herein lies the close relationship to the volume price analysis methodology since the interpretation of both is about judging bars against one another in terms of confirmation of trends, such as rising volume and rising pressure bars, or alternatively falling volume and falling pressure bars signaling that the trend is weakening.
The Volume Relative Strength Index indicator, or VRSI, embodies the core concept of volume-price analysis. It blends trading volume data with price to create an indicator for all the various markets and instruments, whether stocks, ETFs, futures, forex, or cryptocurrencies. The result is an intuitive visual representation of the market’s underlying bullish and bearish pressure in the form of an oscillating histogram with varying colors, with the central fulcrum at zero giving a clear indication when sentiment is shifting from bullish to bearish, or vice versa.
Now, for the first time, you can see the strength of the trend represented visually and clearly based on our two leading indicators of relative volume and price, giving you that essential ingredient we all seek: confidence. And just as with all our other indicators, we urge you to use it in multiple timeframes.