General – getting started
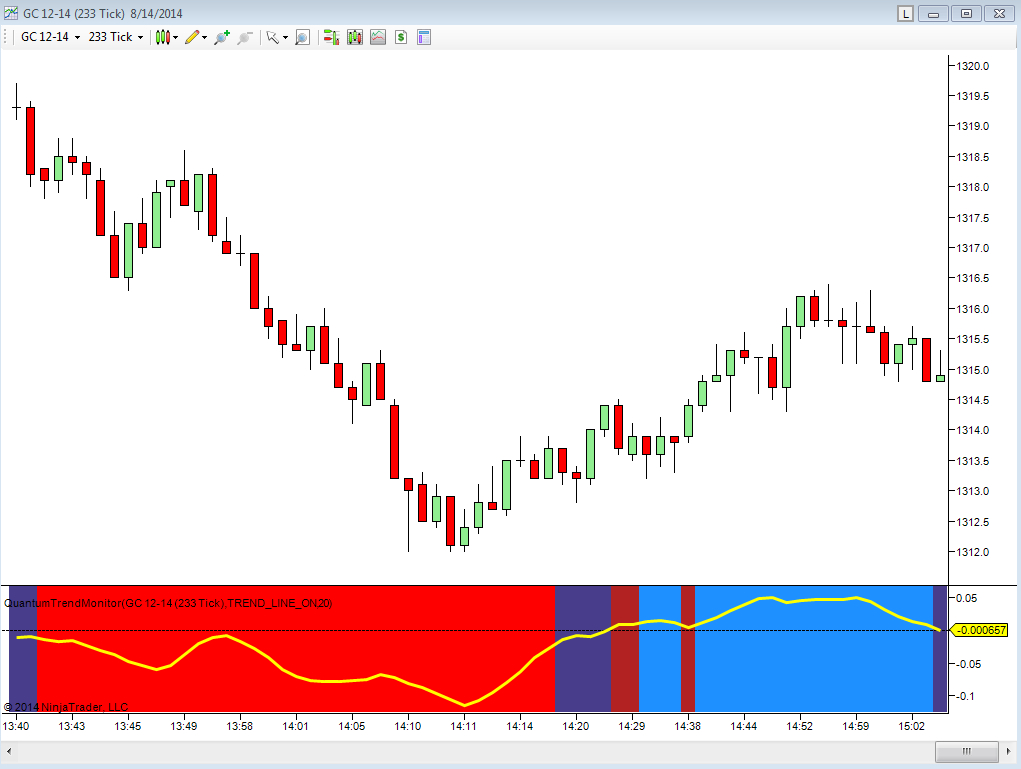
The Quantum Trend Monitor indicator for NinjaTrader is, in fact, two indicators in one. It has been designed to help you stay in trend once it begins, but also to signal when a trend is potentially coming to an end or is simply pausing before continuing. The indicator is best used in conjunction with the Quantum Trends indicator. The Trend Monitor aims to smooth out the minor pullbacks and reversals, which are all part and parcel of the price action, helping to keep you in the trend to maximise the profit potential from every position. This is a function of the solid bar, which displays four colours. When the market is trending strongly, the Trend Monitor is either bright red or bright blue. When the market is in transition or at a pause, the Trend Monitor is either dark red or dark blue. If the Trend Monitor transitions from one bright color to another, ( from red to blue, or form blue to red) then this is signalling that the current trend has potentially come to an end. The Trend Monitor smooths out the ups and downs in a trend, which will be reflected in your Quantum Trends, which then provides the ‘fine detail’ of every move.
The second element of the Trend Monitor indicator for NinjaTrader is the yellow trend line, which displays the ‘strength’ of the trend, and gives an additional perspective on the trend. The trend line moves above and below the ‘mean’ which is displayed as a white dotted line on the indicator. As the trend develops, so the yellow trend line moves above and below the mean level, and as it reaches the extremes, then this is another potential signal, that the trend is becoming exhausted. The trend line indicator can be applied directly on the Quantum Trend Monitor itself, as shown above to keep your charts clean and clear, or separately in another window. As with all the Quantum trading indicators, the Quantum Trend Monitor is best used in multiple timeframes which will then give you visual signals to changes in trend, both upstream and downstream of your principle trading chart.
- The Quantum Trend Monitor indicator for NinjaTrader works in all timeframes from tick to seconds and minutes to months
- The indicator can be ‘fine-tuned’ to your own preferences in terms of the speed with which the indicator will react to possible changes in trend
- For clarity, we find it is best applied to the bottom of the chart
Installation
Open your NinjaTrader platform and select a chart
- Right click – this will open the following window:
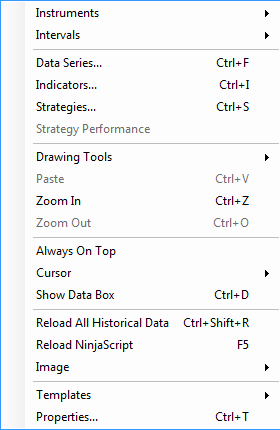
- Left click > Indicators
This will open the following window: (you can also open this window in another way by clicking on the Indicators icon in the NinjaTrader toolbar)
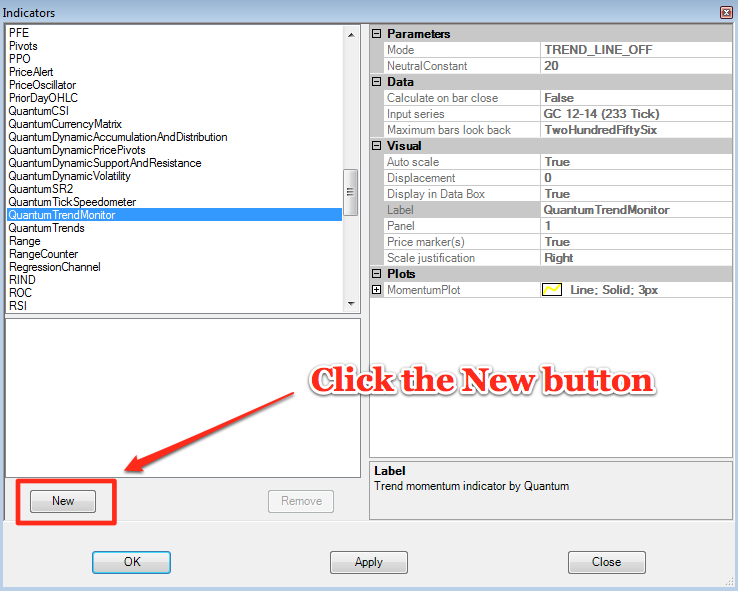
Scroll down to the QuantumTrendMonitor indicator:
- Left click > This will highlight the indicator in blue
- Left click > ‘New’ button as shown above
This will add the QuantumTrendMonitor indicator in the box below as shown here:
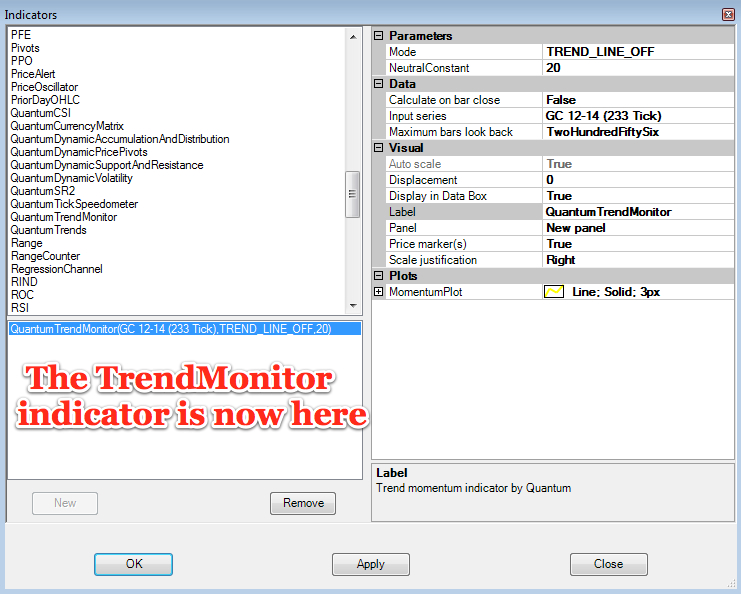
Before clicking the OK or Apply button to complete, the indicator has one or two options which can be configured. You can click the Apply button at any time, and this will apply any changes you have made to the indicator, without closing the window. This will allow you to see the changes you have made, and to modify again before closing with the OK button, or the Close button. All of the user configuration is done on the right hand side of the above screen, which is shown enlarged below. These are the default settings when you first install the indicator to a chart.
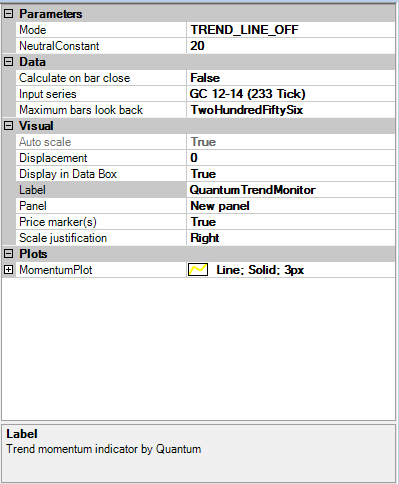
Parameters
These are the Parameters inputs:
Mode – you can select either one of the two options provided here to add or remove the trend line. The trend line is an oscillation line which measures and displays the steepness and the direction of the trend and is applied on top of the TrendMonitor. There are two options – TREND_LINE_OFF and TREND_LINE_ON. The default setting is as shown here which is TREND_LINE_OFF. To apply the trend line to the indicator:
- Left click on the Mode label, and then left click in the value field. A drop down arrow will then appear in the value field. Left click the arrow and then left click the TREND_LINE_ON option, to apply the trend line to the TrendMonitor indicator. If you wish to remove the trend line once applied, simply Left click on the Mode label again, and then left click in the value field. Left click the drop down arrow and left click on TREND_LINE_OFF to remove it once again.
NeutralConstant – this parameter gives you full control over the sensitivity of the TrendMonitor indicator, by allowing you to fine tune the indicator to your own trading style and preferences. Increasing this parameter makes the indicator more sensitive to determining weak trends hence the transitional colors will expand, while reducing the value will also reduce these regions making transitions appear more quickly. This is a personal choice and as always in trading, it’s a question of assessing risk – the risk of getting in too early or too late, and also the risk of getting out too early or staying in too long. From our experience we have found that a value of 20 is a good starting point, and this value can then be adjusted to suit your trading style accordingly. Any number above 20 will increase the periods of congestions, whilst any number below 20 will reduce them accordingly. To change the setting:
- Place your mouse on the NeutralConstant label, and left click. This will highlight NeutralConstant in blue. Left click in the value field alongside and your cursor will appear. Delete the default number using the back button and enter a new number, such as 25 to increase or 15 to decrease
Data
These are the Data inputs:
Calculate on bar close – please DO NOT change this setting and leave as the default of False
Input series – this shows the timeframe for the indicator and will be displayed according to the chart time. In this case the indicator was attached to a 233 tick chart for the GC December contract for gold futures
Maximum bars look back – this is the maximum number of bars in the look back for the indicator. We suggest you leave this as the default of TwoHundredFiftySix as it is memory friendly
Visual
These are the Visual inputs:
Auto Scale – DO NOT change this setting and leave this as the default of True
Displacement – DO NOT change this setting and leave this at the default of 0
Display in Data Box – we suggest you leave this at the default of True
Label – this is the label which will display on the chart once the indicator is attached. You can remove this if you wish as follows:
- Place your mouse on the Label label, and left click. This will highlight Label in blue. Left click in the value field alongside and your cursor will appear. Delete the text using the back button and when you apply the indicator, the text will no longer be displayed
Panel – this specifies the panel number where the indicator will appear. We suggest you leave this as the default of New Panel
Price Marker(s) – please DO NOT alter this setting and leave as the default of True
Scale Justification – please DO NOT alter this setting and leave as the default of Right
Plots
This is where you can change the color and style of the trend line indicator applied to the TrendMonitor indicator MomentumPlot – to access the settings, left click on the MomentumPlot label which will then turn blue. Left click on the + icon and the following options will then be displayed:
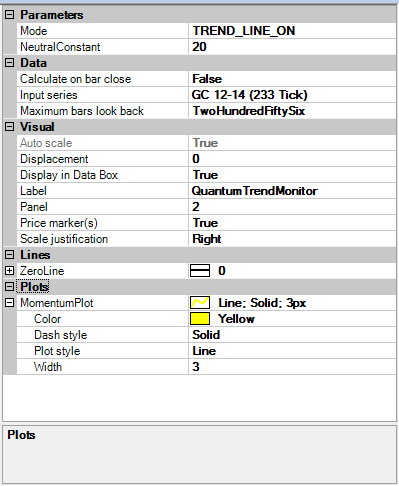
Please make sure the TREND_LINE_ON option is selected in the Mode parameter. As you can see here, the default setting is a yellow Line, Solid and 3px as shown alongside the label field. These can be changed as follows:
Color – to change the color left click on the Color label which will turn blue. A drop down arrow will appear in the value field. Left click the drop down arrow and the color options will then be displayed. Use the scroller on the right to select your preferred color which will then appear in the value field alongside.
Dash style -to change the style of the trend line indicator, left click on the Dash style label which will turn blue. A drop down arrow will appear in the value field. Left click the drop down arrow and the plot style options will then be displayed. Select your preferred style from the drop down menu which will then appear in the value field alongside
Plot style – to change the style of the indicator, left click on the Plot style label which will turn blue. A drop down arrow will appear in the value field. Left click the drop down arrow and the plot style options will then be displayed. Select your preferred style from the drop down menu which will then appear in the value field alongside
Width – to change the width of the trend line, left click on the Width label which will turn blue. Left click the value field alongside and use the back space key to delete the existing value, and replace with a new value. The default is 3px, and any number higher than this will then increase the width of the line, whilst a lower number will decrease the width. You do not need to enter ‘px’ after the number. Simply enter a whole number to change the width of the line to your preferred appearance Once you have made all the changes to the settings for the QuantumTrendMonitor indicator left click the OK button to complete and update the indicator.
Removing an indicator
These are the steps to remove an indicator from a chart: Right click on the chart and then left click on Indicators from the pop up menu. Scroll down to the indicator you wish to remove and left click which will turn the indicator blue. This will then display the indicator window with its settings as shown below:
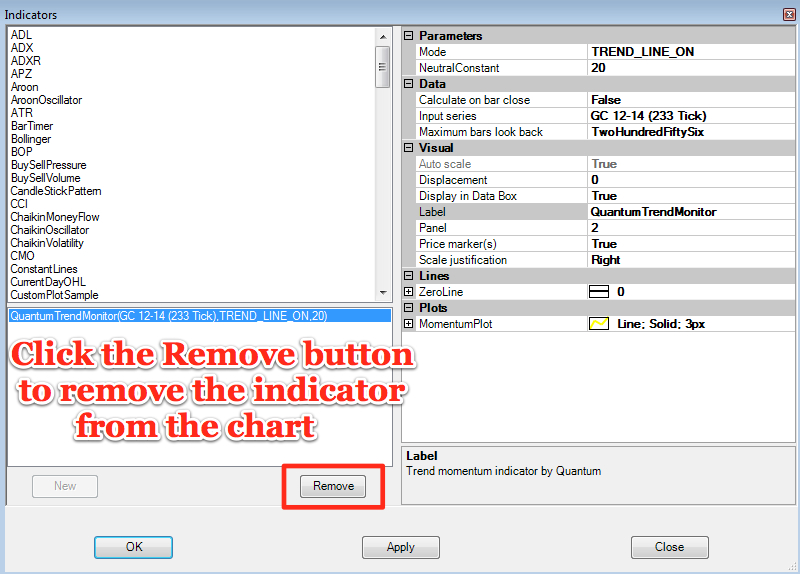
Simply left click on the Remove button as shown above, and the indicator will disappear from the list of indicators on the chart. To confirm left click the OK button to confirm and close the window.


