General – getting started
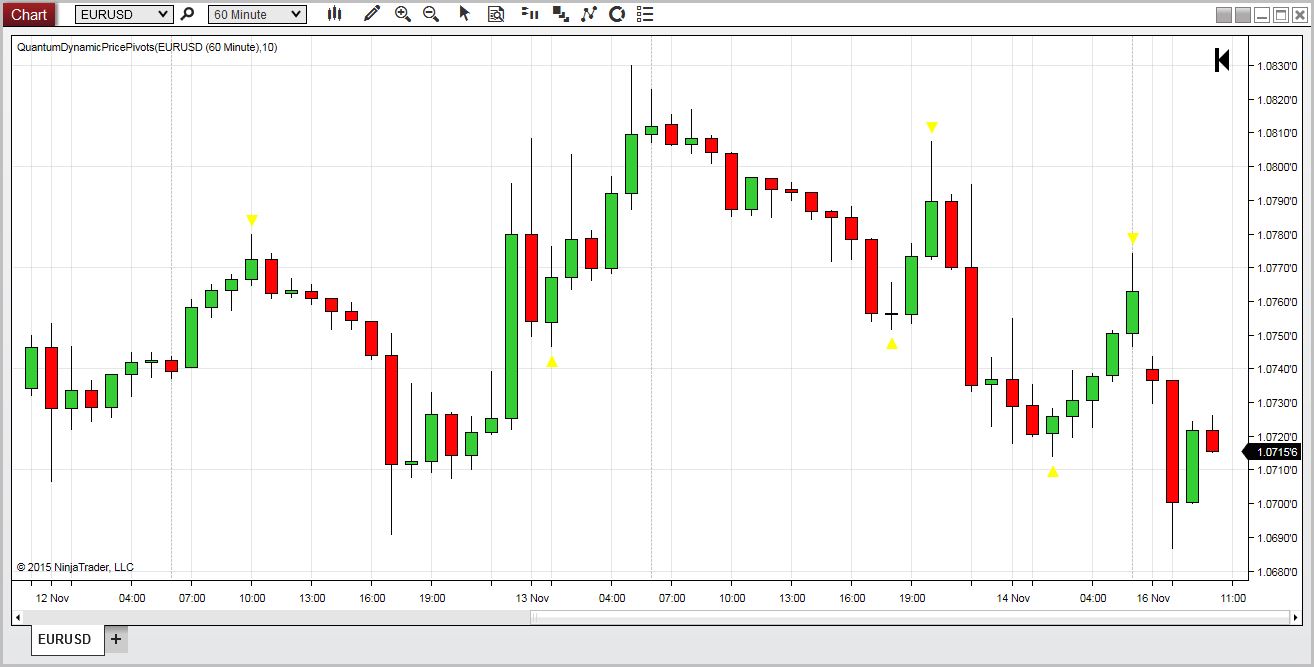
The Dynamic Price Pivots indicator for NinjaTrader has been designed and developed to help you take advantage of leading price action in several different ways. We call it dynamic because that’s what it is, dynamically signalling changes in sentiment at the live edge of the market using a three candle pattern. If the centre candle has lower highs and lower lows than the candles on either side, then a pivot low is triggered, and conversely, if the centre candle has higher highs and higher lows, then a pivot high is formed. The indicator is triggered on the close of the candle.
The Dynamic Price Pivots indicator for NinjaTrader 8, can be used in several different ways, which is why we refer to it as the ‘Swiss Army Knife’ of trading indicators – a simple yet powerful indicator.
First, the indicator can be used to identify changes in market sentiment, as the market ebbs and flows from bullish to bearish and back again. Second, the indicator can be used to identify support and resistance regions as they build in realtime. The pivot highs and the pivot lows define the floor and ceiling of support and resistance dynamically. Finally, the pivots can also be used to define the upper and lower regions of trends, again, as they build dynamically.
The Dynamic Price Pivots indicator is not an entry or exit signal indicator, but one that is used with a variety of others, including volume, to help define the market state in realtime. Are you in a congestion phase which is building, or a trend which is developing. The Dynamic Price Pivots indicator will help to frame the market conditions, which you can then confirm with all your other trading indicators. The Quantum Dynamic Price Pivots indicator works in all timeframes from seconds to months and also on tick charts.
Installation
Open your NinjaTrader 8 platform and select a chart.
Right click the chart to bring up a menu which looks like the following image:
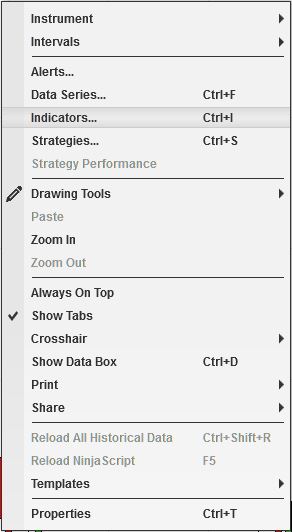
Select Indicators… which will open the following window. (Alternatively, you can open this window by clicking the Indicators button in the chart toolbar or by pressing Ctrl + I while focused on the chart.)
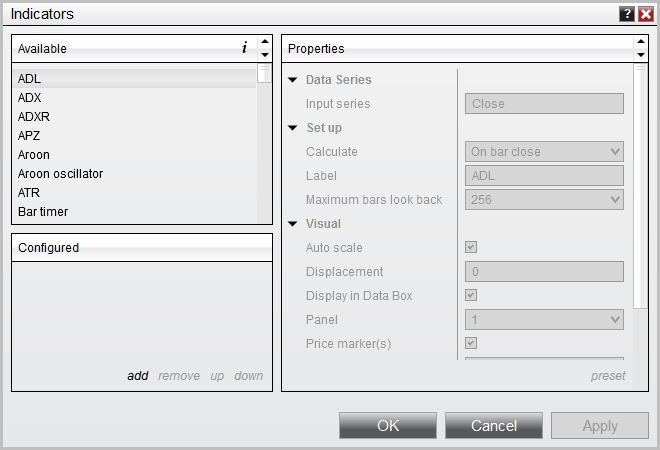
In the Indicators window, scroll down to the QuantumDynamicPricePivots indicator and click it to select the indicator. Once selected, click add in the Configured frame which will put it on the list of active indicators to be added in the chart.
Before clicking the OK or Apply button to complete, the indicator has a number of options which can be configured. You can click the Apply button at any time, and this will apply any changes you have made to the indicator without closing the window. This will allow you to see the changes you have made to the indicator, without closing with the OK button or the Cancel button.
Configuration
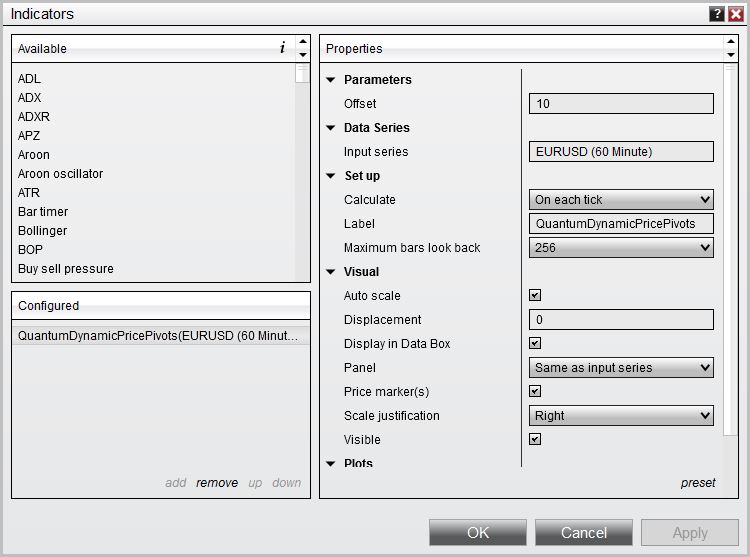
All of the user configuration is down on the right hand side of the Indicator window. These are the default setting when you first install the indicator to a chart.
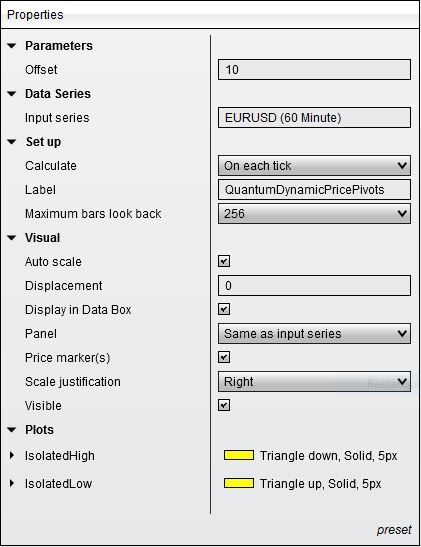
Parameters
Offset – this adjusts the vertical distance of the pivot from the candle or bar. The default is 10 but you can change this to suit your own personal preference. A higher number will move it further way, whilst a lower number will move it closer.
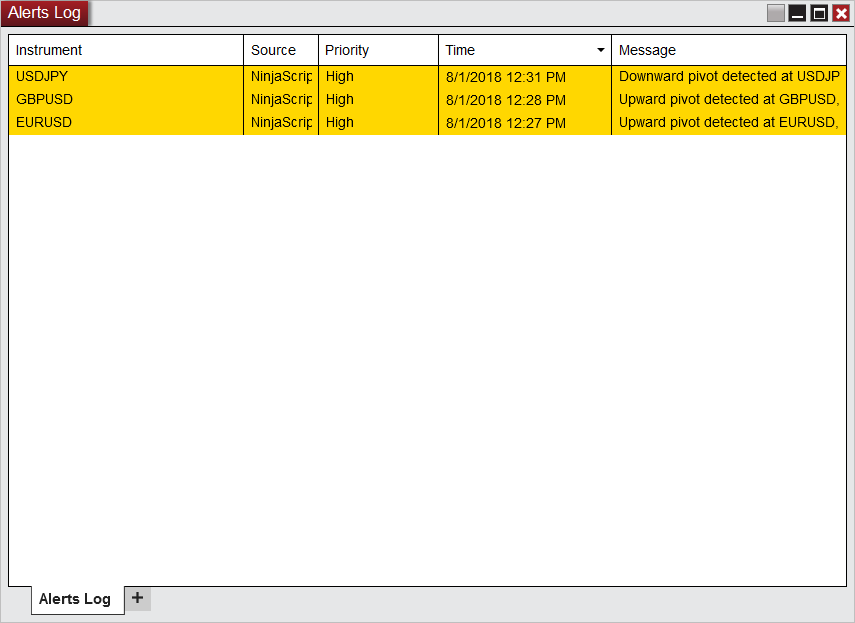
EnableAlerts – When ticked, the indicator lets you know when a pivot up or pivot down signal is detected and displays it in the NinjaTrader Alerts window.
Data Series
Input series – this shows the timeframe for the indicator and will be displayed according to the chart time.
Set up
Calculate – please DO NOT change this setting and leave as the default of On each tick.
Label – there is no need to change the value of this configuration.
Maximum bars look back – this is the maximum number of bars in the look back for the indicator. We suggest you leave this as the default of 256 as it is memory friendly
Visual
Auto Scale – DO NOT change this setting and leave this as the default of True
Displacement – DO NOT change this setting and leave this at the default of 0
Display in Data Box – we suggest you leave this at the default of True (checked)
Panel – this specifies the panel number where the indicator will appear. We suggest you leave this as the default of ‘Same as input series’
Price Marker(s) – please DO NOT alter this setting and leave as the default of True (checked)
Scale Justification – please DO NOT alter this setting and leave as the default of Right
Plots
This is where you can change various properties of the indicator’s plots:
- Isolated High – refers to the pivot created to the top of the candle (bearish signal)
- Isolated Low – refers to the pivot created to the bottom of the candle (bullish signal)
A list of plot styles or properties will be shown to you by clicking the arrow graphic beside the plot for you to customize the appearance of the plot to your liking:
- Color – default is Yellow
- Dash style – default is Solid, but changing this property does not affect the appearance of the plot
- Plot style – default is Triangle up for Isolated Low and Triangle down for Isolated High
- Width – default is 5
Once you have made any changes to the settings for the Dynamic Price Pivots indicator, left click the OK button to complete and update the indicator.
Removing an indicator
These are the steps to remove an indicator from a chart.
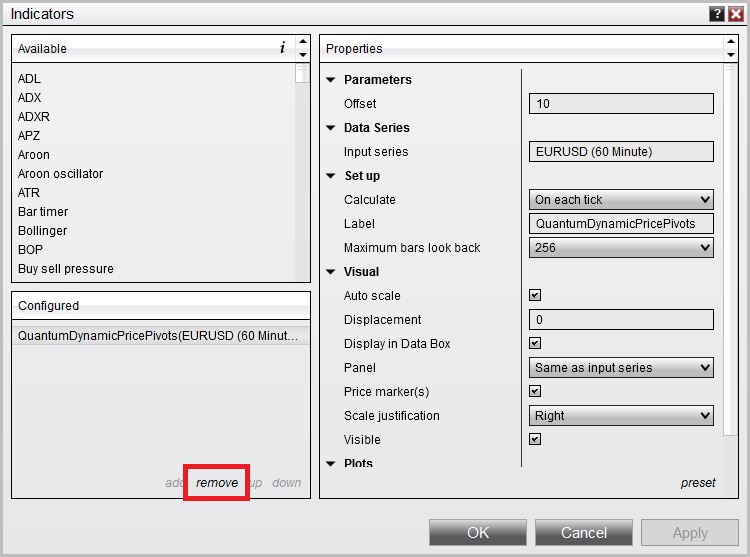
Right click on the chart then select Indicators from the menu. Select QuantumDynamicPricePivots from the Configured frame and click remove. Click OK to confirm and the indicator should be unloaded from your chart.


