General – getting started
Of all the four principle capital markets, the world of foreign exchange trading is the most complex and most difficult to master, unless of course you have the right tools! The reason for this complexity is not hard to understand and the reason we developed the currency matrix indicator for NinjaTrader.
First currencies are traded in pairs. Each position is a judgment of the forces driving two independent markets. If the GBP/USD for example is bullish, is this being driven by strength in the pound, or weakness in the US dollar. Imagine if we had to do the same thing trading stocks for example. Consider trading Google against Amazon. If this ‘pair’ were rising, is this being driven by strength in Google or weakness in Amazon? Almost impossible to analyse.
To compound this problem, every currency can be bought or sold against a myriad of other currencies. This raises the next key question. If the GBP/USD is bullish once again, is the British pound strong against all the other major currencies, such as the GBP/JPY, the GBP/CAD, the EUR/GBP etc. If it is, then this is clearly a sign that the UK pound is being bought universally in the market. Equally for the US dollar, if it is sold universally in pairs such as the USD/CAD, the USD/JPY and others, then we can assume that the GBP/USD is rising as a result of strong buying of the pound universally, and strong selling across the market of the US dollar.
Finally, we come to the third problem, which is trying to assess the strength of this buying or selling. After all a currency may be overbought (strong) or oversold (weak) but how strong is strong, and how weak is weak.
Consider this for a moment. Assume you have decided to buy the GBP/USD and have the following information to help you in your analysis:
- Whether the GBP is also being bought in all the other cross currency pairs
- Whether the USD is also being sold in all the other major currency pairs
- The relative strength of buying in the GBP/USD pair
Trading success is all about assessing risk and the probability of success on each trade. Would this information give you a high risk, medium or low risk trading position? And the answer……… is a low risk trading opportunity. After all, you are now taking a position based on a view across the market.
First, if you are basing your decision on universal buying or selling of a currency, then you are trading with the entire weight of the market, and not just on the analysis of one currency pair – it’s low risk. Second, if you know the relative strength of this buying or selling against all the other currency pairs, then this gives you the complete picture – if its strong, then again – it’s low risk. Third and last, if you know what the counter currency is also doing in terms of strong or weak, then once more if its strong – it’s low risk.
This is where the Quantum Currency Matrix indicator for NInjaTrader steps in. It provides the solution to all three problems in one elegant trading indicator, and is a complimentary indicator to the Quantum Currency Strength Indicator. It shows you the complete picture across the market in a simple matrix, which works in all timeframes from seconds to months on the Ninjatrader platform.
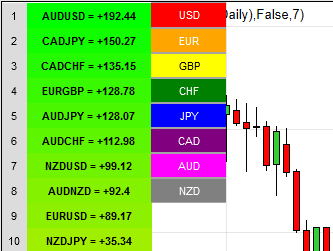
From the eight major currencies come the 28 currency pairs which are then displayed in a table, with their relative strength scores, updated second by second and minute by minute.
Each currency pair has a strength score calculated in real time, which is then displayed in the matrix which are ranked VERTICALLY using a dynamic graded color code transitioning from green, to yellow, and to red in that order. The currency pairs are then ranked by their sum from the most positive to the most negative and are color coded as follows:
- Green shades – the sum of the currency pair’s performance scores in 9 timeframes is well above the fulcrum of zero.
- Yellow shades – the sum of the currency pair’s performance scores in 9 timeframes is relatively flat and around the fulcrum of 0. It can either be positive or negative but trails the numbers closest to 0.
- Red shades – the sum of the currency pair’s performance scores in 9 timeframes is well below the fulcrum of zero.
Each currency can then be isolated to show the 7 associated pairs and their relative scores. If all the associated pairs are showing similar strength (either bullish or bearish) then this is either a good time to join the move, or alternatively it may be an opportunity to wait for a reversal in trend as the pair becomes overbought or oversold.
The Quantum Currency Matrix gives you the tool to see the complexities of the forex market in real time across all the related pairs, along with the strength of the buying and selling. Whilst it is possible to do this manually using multiple charts, what a manual matrix will not provide is any measure of the relative strength. The indicator does this for you automatically by considering the price action across all the related currency pairs and then deriving the relative strength scores accordingly.
The Quantum Currency Strength indicator and the Quantum Currency Matrix are the perfect combination. The first gives you the ‘heads up’ on the individual currencies. The second then completes the picture, giving you a three dimensional view across the 28 currency pairs. Together they allow you to assess the probable risk on each and every trade – instantly – giving you the tools to trade every pair with complete confidence.
- Your Quantum Currency Matrix indicator can be applied to any chart for any currency pair. The chart does not influence or affect the appearance or performance of the indicator. For example you can apply the indicator to a $GBPUSD, a $EURUSD, or a $USDCHF, or any other pair. The Ninjatrader indicator will display in an identical way on each chart.
- The Ninjatrader indicator will work in all timeframes including from seconds, to minutes and months
- When you first apply the indicator, please allow a few seconds for the data to build in history.
By itself, the Quantum Currency Matrix indicator is a powerful tool for quickly and easily identifying trading opportunities. However, it was developed as part of what we like to call the Quantum Currency Dashboard, which consists of the following indicators:
- Quantum Currency Strength Indicator (CSI)
- Quantum Currency Matrix
- Quantum Currency Array
- Quantum Currency Heatmap
These four indicators then provide a unique and compact insight into all the various aspects of strength and weakness for both currencies and currency pairs, from trend and momentum to overbought and oversold. What is unique is that using four charts, you are then able to monitor the myriad combinations of strength, weakness, momentum, congestion and divergence across the entire forex complex at a click of a button. And even more powerfully, giving you the confidence to get in and stay in for maximum profits. No more missed opportunities, no more struggling with multiple charts, and no more trader regret, whatever your trading style or approach.
Installation
Open the NinjaTrader 8 platform and select a chart.
Right click the chart to bring up a menu which looks like the following image:
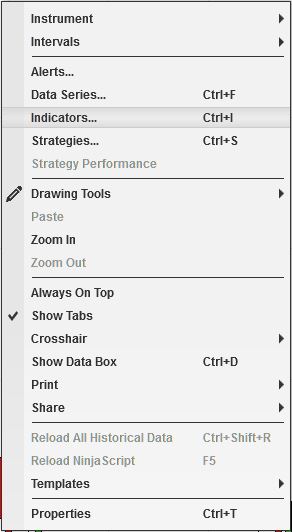
Select Indicators… which will open the following window. (Alternatively, you can open this window by clicking the Indicators button in the chart toolbar or by pressing Ctrl + I while focused on the chart)
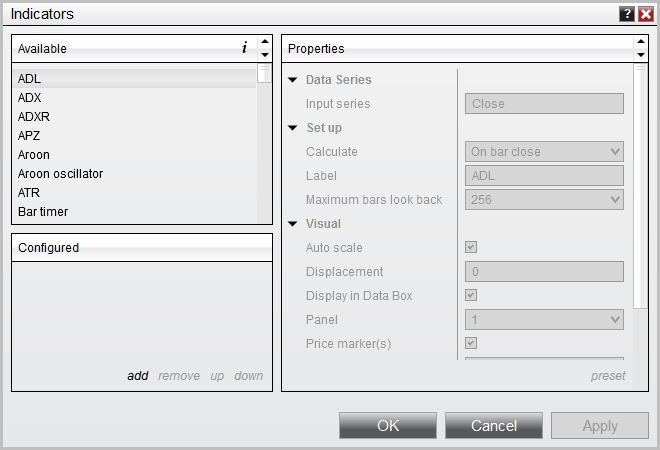
In the Indicator window, scroll down to the QuantumCurrencyMatrix indicator and click it to select the indicator. Once selected, click add in the Configured frame which will put it on the list of active indicators to be added in the chart.
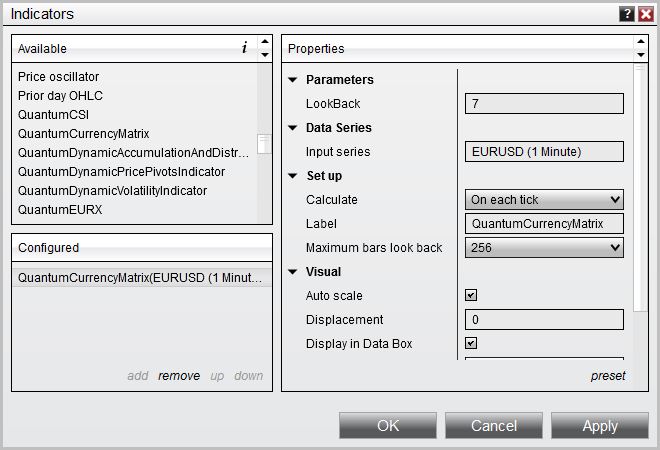
Before clicking the OK or Apply button to complete, the indicator has a number of options which can be configured. you can click the Apply button at any time, and this will apply any changes you have made to the indicator without closing the window. This will allow you to see the changes you have made to the indicator, without closing with the OK button or the Close button.
Configuration
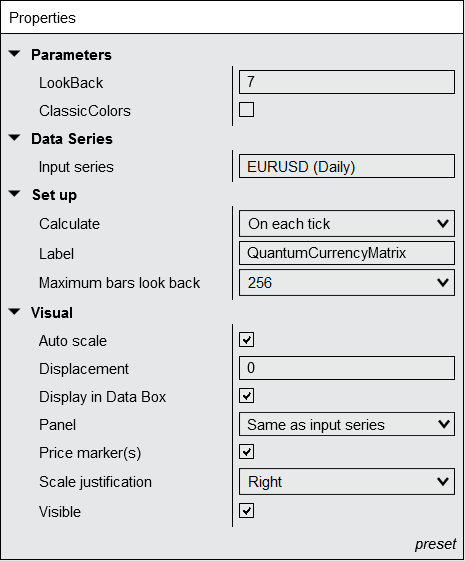
All of the user configuration is down on the right hand side of the Indicator window. These are the default setting when you first install the indicator to a chart.
Parameters
These are the Parameters inputs:
LookBack– this is the number of bars that the indicator processes during the calculation. The default is 7 and we suggest you leave it at this setting.
ClassicColors – this changes the color scheme of the Currency Matrix to the classic blue and red. It is unchecked/false by default.
USDButtonColor – This property defines the color of the USD button. Its default color is red.
EURButtonColor – This property defines the color of the EUR button. Its default color is orange,
GBPButtonColor – This property defines the color of the GBP button. Its default color is yellow.
CHFButtonColor – This property defines the color of the CHF button. Its default color is green.
JPYButtonColor – This property defines the color of the JPY button. Its default color is blue.
CADButtonColor – This property defines the color of the CAD button. Its default color is purple.
AUDButtonColor – This property defines the color of the AUD button. Its default color is magenta.
NZDButtonColor – This property defines the color of the NZD button. Its default color is gray.
BookmarkedCurrencyPairs – This is a new feature we added to the Currency Matrix which helps you keep track of currency pairs you’re interested in wherever they are in the list. To bookmark a currency pair, simply enter its symbol (without any prefix or suffix) in this field like so:
eurusd
You can bookmark multiple currency pairs at the same time by adding a space between them. For example, if you like to bookmark EURUSD, AUDCHF and USDJPY, simply enter the following value in this field:
eurusd audchf usdjpy
All bookmarked currency pairs are given a distinct color so you can see them easily in the constantly changing list. They are also not affected by the currency filters.
Data Series
Input series – this shows the timeframe for the indicator and will be displayed according to the chart time. In this case the indicator was attached to a 1 minute time chart
Set up
Calculate – please DO NOT change this setting and leave as the default of On each tick.
Label – there is no need to change the value of this configuration.
Maximum bars look back – this is the maximum number of bars in the look back for the indicator. We suggest you leave this as the default of 256 as it is memory friendly
Visual
These are the Visual inputs:
Auto Scale – DO NOT change this setting and leave this as the default of True (checked)
Displacement – DO NOT change this setting and leave this at the default of 0
Display in Data Box – we suggest you leave this at the default of True (checked)
Label – this is the label which will display on the chart once the indicator is attached.
Panel – this specifies the panel number where the indicator will appear. We suggest you leave this as the default of ‘Same as input series’
Price Marker(s) – please DO NOT alter this setting and leave as the default of True (checked)
Scale Justification – please DO NOT alter this setting and leave as the default of Right
Once you have made any changes to the settings for the Quantum Currency Matrix indicator, left click the OK button to complete and update the indicator.
Filtering out currency pairs
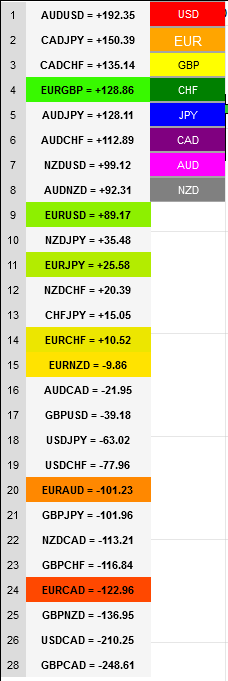
The default setting for the indicator is to display all 28 currency pairs from those which are the most strongly bullish, to thise which are the most strongly bearish in a currency matrix ladder. Bullish currency pairs are shown in shades of green to yellow with a positive number, whilst this which are bearish are shown in shades of yellow to red, with a negative number. The crossover point on any timeframe is 0.
The indicator includes a filter option which allows you to quickly filter out related pairs.
The filtering option appears just below the list of currencies. Here you will find the eight major currencies. In order to filter out the Euro pairs for example, click on the EUR legend, and this will then only display the EUR related pairs and appear as shown here:
The indicator now only displays all seven EUR pairs, and the EUR legend also changes font size to indicate that it is selected. The colors are also matched with the default colors of the Currency Strength Indicator. To investigate another currency simply click the related currency legend, and this will then display the seven filtered currency pairs for that currency.
To revert back to all 28 currency pairs, click on the selected currency legend again, and all twenty eight currencies will then be displayed once again in the currency matrix. Each currency legend acts as a toggle, allowing you to sift through the 28 currency pairs for a particular group quickly and easily.
Resizing the indicator
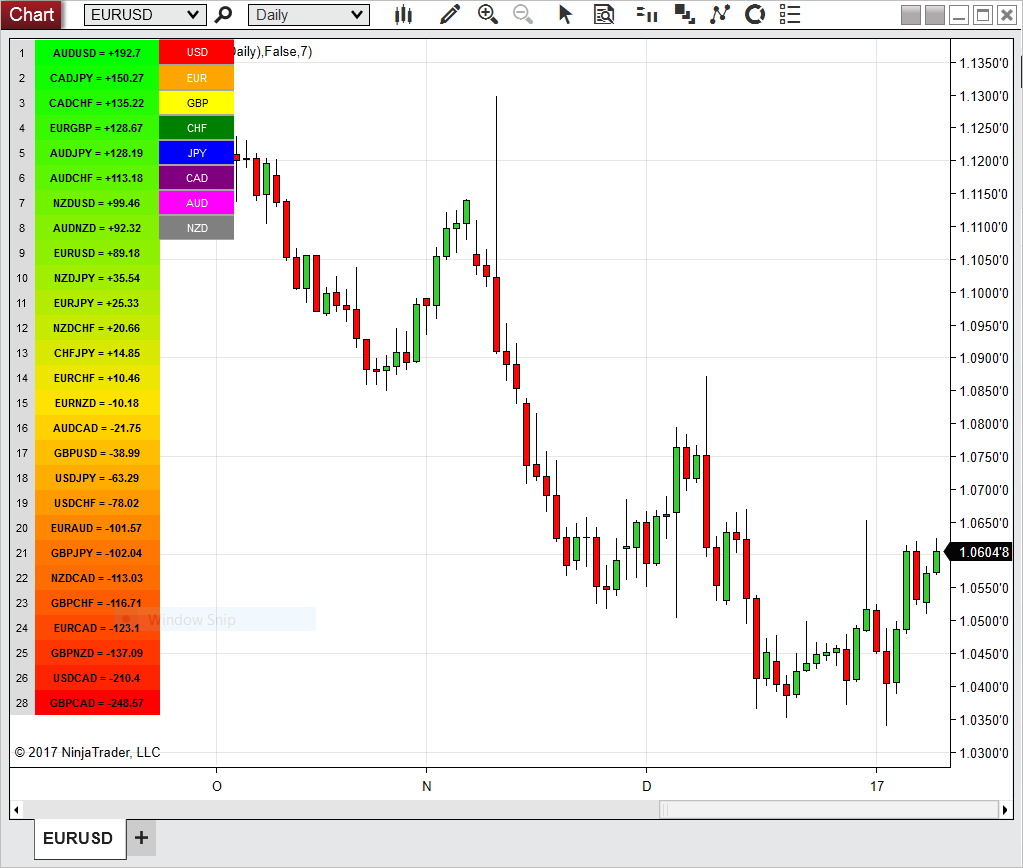
The Currency Matrix indicator on NinjaTrader 8 is conveniently compact so that you can save as much space in your monitor for your other trading tools. Below is an example of how the indicator may look like when you apply it to a chart.
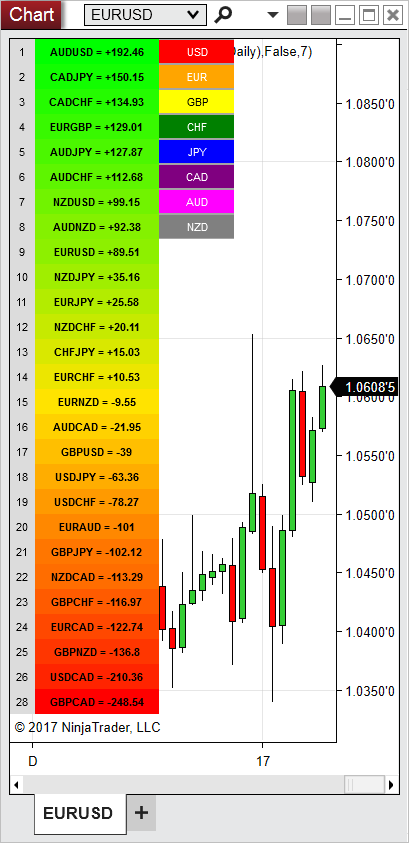
To hide the chart and to maximise the space on your trading screen, hover your pointer over the right hand edge of the chart, and a white bar horizontal bar will appear with an arrow at either end. Left click and drag to the left which will then resize the window horizontally, and it will now look like this:
Removing an indicator
These are the steps to remove an indicator from a chart.
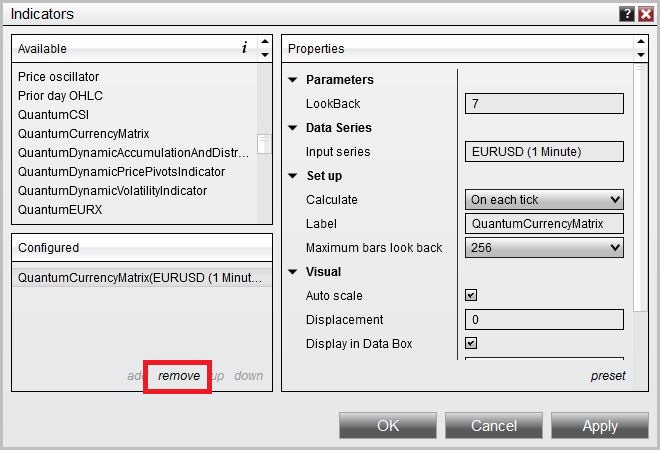
Right click on the chart then select Indicators… from the menu. Select QuantumCurrencyMatrix from the Configured frame and click remove. Click OK to confirm and the indicator should be unloaded from your chart.


