General – getting started
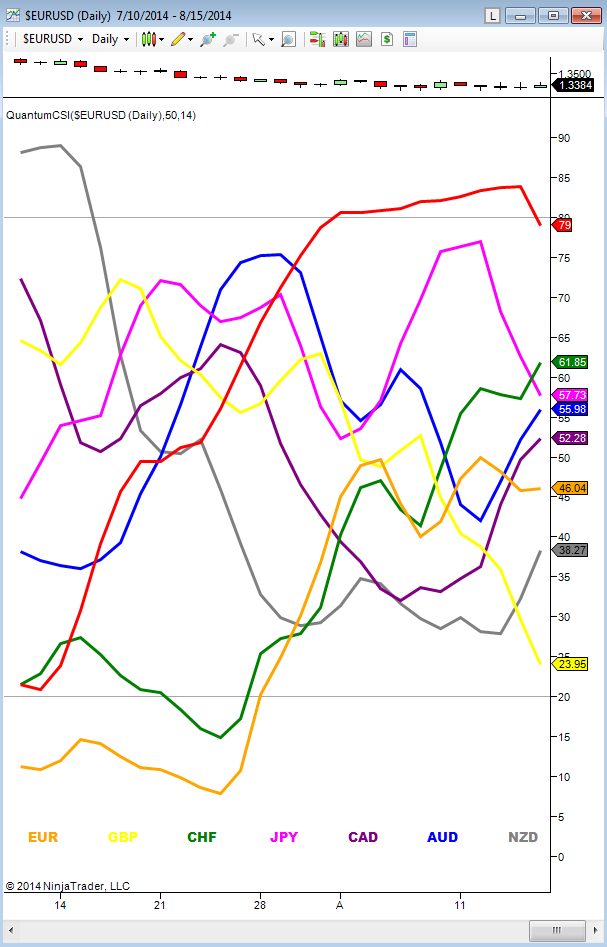
The Quantum Currency Strength Indicator for NinjaTrader has been designed to show you easily and quickly when a currency is moving strongly in one direction or another, either to an oversold state, or to an overbought state. Currencies and currency pairs move constantly from one to the other in all timeframes.
These are the points at which a currency is likely to reverse and change trend. The overbought and oversold regions on the indicator are defined by the solid grey lines at 20 and 80, and once these regions are approached, then this is a signal for further analysis on the chart. Using the currency strength indicator on Ninjatrader in multiple timeframes is an excellent way to see whether a currency is rising or falling across several timeframes, adding a further dimension to your analysis, and allowing you to quantify the risk on any trade in a more detailed way.
Whilst this Ninjatrader indicator has been designed to show you when currencies are potentially overbought or oversold, the Quantum Currency Strength Indicator for NinjaTrader will also show you when currencies are in congestion phases as they meander and bunch together. Typically, this is seen ahead of major news releases as the currency markets pause and wait before the release.
Finally, the indicator will also help you monitor current positions, showing when a currency has moved from one extreme to another and perhaps signalling a potential reversal in the opposite direction.
- Your Quantum CSI currency strength indicator for NinjaTrader can be applied to any chart for any currency pair. The chart does not influence or affect the appearance or performance of the indicator. For example, you can apply the indicator to a $GBPUSD, a $EURUSD, or a $USDCHF, or any other pair. The indicator will display identically on each chart.
- The indicator will work in all timeframes from seconds, to minutes, hours and months on the Ninjatrader platform
- When you first apply the indicator, please allow a few seconds for the data to build in history.
- The solid grey lines at the top and bottom of the indicator (80 at the top) and (20 at the bottom) are not designed as an entry or exit signal. They are simply there to give a guide as to when a currency is approaching or moving into an oversold or overbought region, in that timeframe.
Installation
Open your NinjaTrader platform and select a chart
- Right click
This will open the following window:
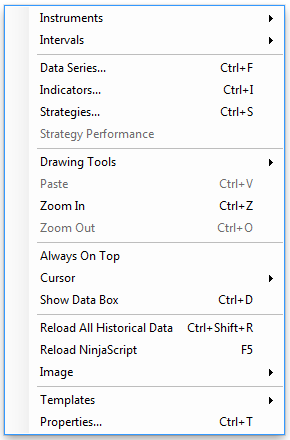
- Left click > Indicators
This will open the following window: (you can also open this window in another way by clicking on the Indicators icon in the NinjaTrader toolbar)
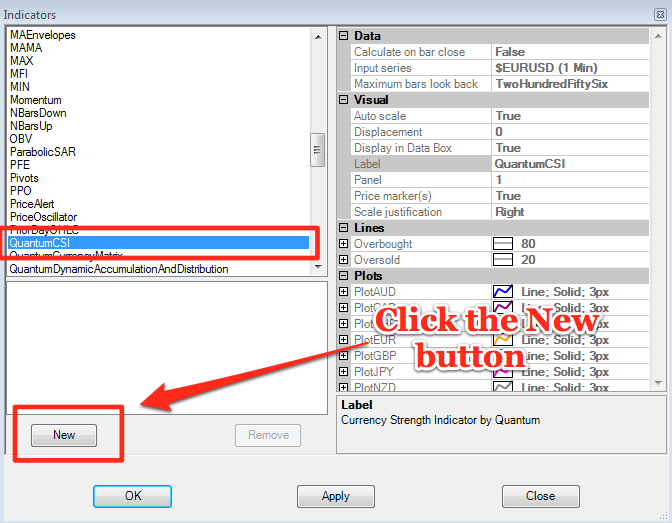
Scroll down to the QuantumCSI indicator:
- Left click > This will highlight the indicator in blue
- Left click > ‘New’ button as shown above
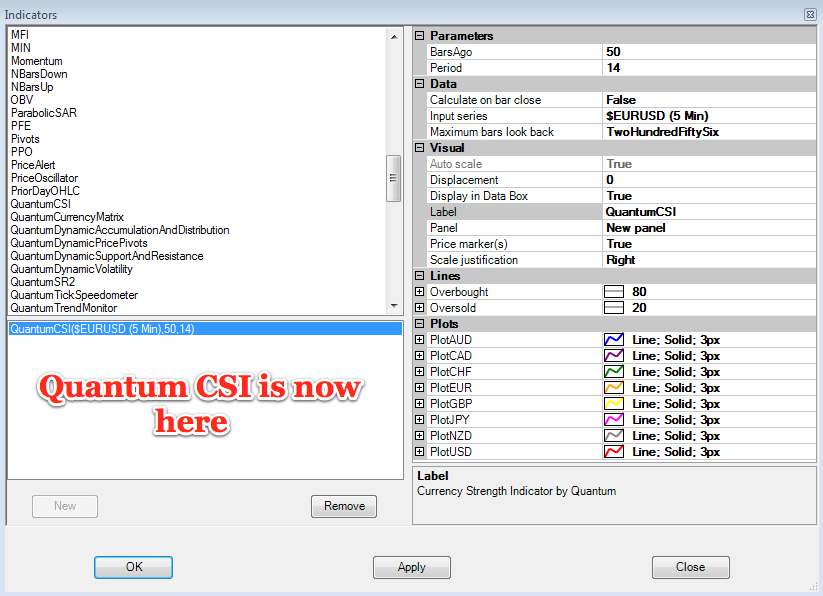
This will add the QuantumCSI in the box below as shown here:
Before clicking the OK or Apply button to complete, the indicator can be configured in several different ways to suit your own personal preferences and trading style. You can click the Apply button at any time, and this will apply any changes you have made to the indicator, without closing the window. This will allow you to see the changes you have made, and to modify again before closing with the OK button, or the Close button.
All of the user configuration is done on the right hand side of the above screen, which is shown enlarged below. These are the default settings when you first install the indicator to a chart.
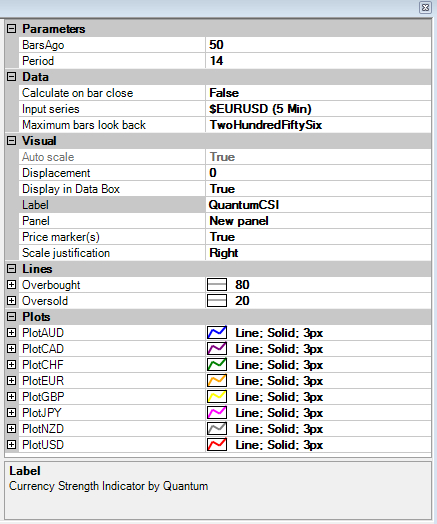
Parameters
These are the Parameters inputs:
BarsAgo – this is the number of bars that the indicator processes during the calculation. The CSI requires a significant amount of processing power compared to most indicators, and this is the recommended setting. The higher the setting then the more processing power is required and we suggest it remains at 50, although you can change this if you wish.
- Place your mouse on the BarsAgo label, and left click. This will highlight BarsAgo in blue. Left click in the value field alongside and your cursor will appear. Delete the value using the back button, and enter a new value.
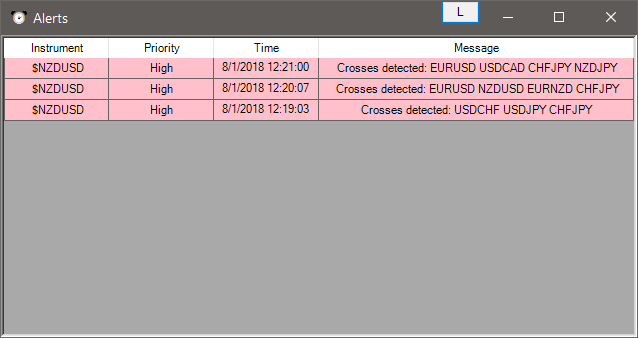
DetectCrosses – A new feature that we have introduced in the Currency Strength Indicator for NinjaTrader 7 is an alert system for currency crosses which has been requested by some of our customers who are interested in taking advantage of trading opportunities found at such points. A currency cross happens when one currency line intersects with another which indicates a significant price action between the two currencies, and signals the development of a trend which is already in place.
It is set to false by default but when changed to true, you will be prompted through the NinjaTrader Alert window about all the currencies that have crossed.
Period – this setting is used to ‘fine tune’ the internal RSI indicator of the currency strength indicator. Increasing the value makes the indicator less responsive to price movement, thus the steepness of the curves decrease. A higher Period also means that currencies are less likely to cross the 80 and 20 lines. Conversely, decreasing it makes the indicator more responsive to price movement, thus the steepness of the curves increases. A lower Period also means that currencies are more likely to cross the 80 and 20 lines and also stay there for longer periods of time. The recommended settings range from 7 to 14. For medium to longer term trading approaches then the higher Period is recommended (towards 14 or above), whilst for faster scalping trading approaches, then a lower Period can be applied (towards 7 or below). To change the setting:
- Place your mouse on the Period label, and left click. This will highlight Period in blue. Left click in the value field alongside and your cursor will appear. Delete the value using the back button, and enter the new value. Single digit numbers are entered as 5 or 7 ( not as 05 or 07)
ShowUSD – This property controls the visibility of the USD currency line.
ShowEUR – This property controls the visibility of the EUR currency line.
ShowGBP – This property controls the visibility of the GBP currency line.
ShowCHF – This property controls the visibility of the CHF currency line.
ShowJPY – This property controls the visibility of the JPY currency line.
ShowCAD – This property controls the visibility of the CAD currency line.
ShowAUD – This property controls the visibility of the AUD currency line.
ShowNZD – This property controls the visibility of the NZD currency line.
Data
These are the Data inputs:
Calculate on bar close – please DO NOT change this setting and leave as the default of false
Input series – this shows the timeframe for the indicator and will be displayed according to the chart time. In this case the indicator was attached to a 5 minute time chart
Maximum bars look back – this is the maximum number of bars in the look back for the indicator. We suggest you leave this as the default of TwoHundredFiftySix as it is memory friendly
Visual
These are the Visual inputs:
Auto Scale – DO NOT change this setting and leave this as the default of True
Displacement – DO NOT change this setting and leave this at the default of 0
Display in Data Box – we suggest you leave this at the default of True
Label – this is the label which will display on the chart once the indicator is attached. You can remove this if you wish as follows:
- Place your mouse on the Label label, and left click. This will highlight Label in blue. Left click in the value field alongside and your cursor will appear. Delete the text using the back button and when you apply the indicator, the text will no longer be displayed
Panel – this specifies the panel number where the indicator will appear. We suggest you leave this as the default of New panel.
Price Marker(s) – please DO NOT alter this setting and leave as the default of True
Scale Justification – please DO NOT alter this setting and leave as the default of Right
Lines
These are the two lines which define the oversold and overbought regions on the indicator. The default settings are 80 and 20, but you can move these levels higher or lower if you prefer. There are several settings which you can change here, both in terms of the location of these lines and in the color and style.
Overbought – to access the settings for this line, left click on the Overbought label which will then turn blue. Left click on the + icon and the following options will then be displayed:
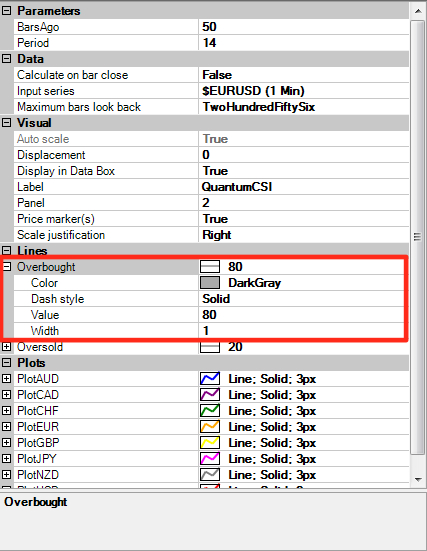
There are four inputs you can change as follows:
- Color – to change the color left click on the Color label which will turn blue. A drop down arrow will appear in the value field. Left click the drop down arrow and the color options will then be displayed. Use the scroller on the right to select your preferred colour, which will then appear in the value field.
- Dash style – to change the style of the line, left click on the Dash style label which will turn blue. A drop down arrow will appear in the value field. Left click the drop down arrow and the line style options will then be displayed. Use the scroller on the right to select your preferred style which will then appear in the value field alongside.
- Value – to change the value of the line, left click on the Value label which will turn blue. Left click the value field alongside and use the back space key to delete the existing value, and replace with a new value. Any number above 80 will move the level of the overbought line higher, and any number below 80 will move the level lower
- Width – to change the value of the line, left click on the Width label which will turn blue. Left click the value field alongside and use the back space key to delete the existing value, and replace with a new value. The default is 1, and any number higher than this will then increase the width of the line
Oversold – to access the settings for this line, left click on Oversold label which will then turn blue. Left click on the + icon and the following options will then be displayed:
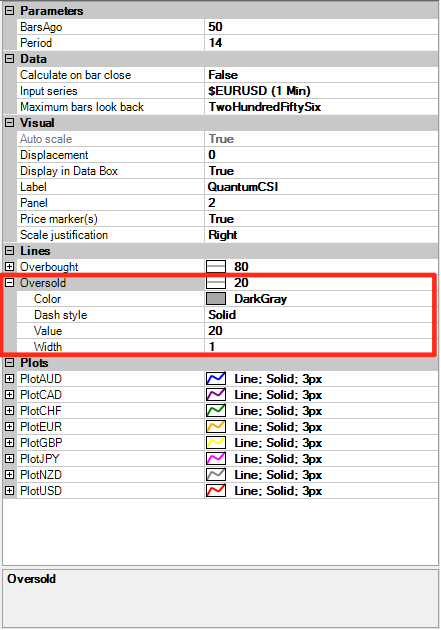
There are four inputs you can change as follows:
Color – to change the color left click on the Color label which will turn blue. A drop down arrow will appear in the value field. Left click the drop down arrow and the color options will then be displayed. Use the scroller on the right to select your preferred color which will then appear in the value field alongside.
Dash style – to change the style of the line, left click on the Dash style label which will turn blue. A drop down arrow will appear in the value field. Left click the drop down arrow and the line style options will then be displayed. Use the scroller on the right to select your preferred style which will then appear in the value field alongside.
Value – to change the value of the line, left click on the Value label which will turn blue. Left click the value field alongside and use the back space key to delete the existing value, and replace with a new value. Any number above 20 will move the level of the oversold line higher, and any number below 20 will move the level lower
Width – to change the value of the line, left click on the Width label which will turn blue. Left click the value field alongside and use the back space key to delete the existing value, and replace with a new value. The default is 1, and any number higher than this will then increase the width of the line
Plots
This is where you can change the color and style of each of the currency lines. When you change the color of any line, this will also update the color of the currency icon at the bottom of the indicator. To change any color is the same for each currency line, and for simplicity only one example is shown below for the PlotAUD options.
PlotAUD – to access the settings for this line, left click on the PlotAUD label which will then turn blue. Left click on the + icon and the following options will then be displayed:
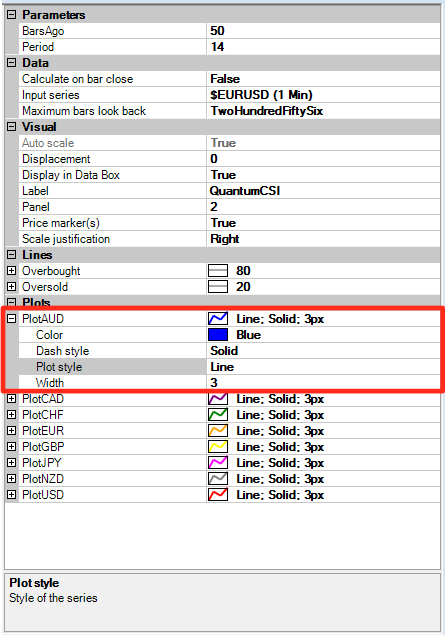
As you can see here, the default settings for all the currency lines is for a solid line, with a 3 px setting which is shown alongside each of the value fields for each currency.
Color – to change the color left click on the Color label which will turn blue. A drop down arrow will appear in the value field. Left click the drop down arrow and the color options will then be displayed. Use the scroller on the right to select your preferred color which will then appear in the value field alongside.
Dash style – to change the style of the line, left click on the Dash style label which will turn blue. A drop down arrow will appear in the value field. Left click the drop down arrow and the line style options will then be displayed. Use the scroller on the right to select your preferred style which will then appear in the value field alongside.
Plot style – to change the style of the line, left click on the Value label which will turn blue.. A drop down arrow will appear in the value field. Left click the drop down arrow and the plot style options will then be displayed. Use the scroller on the right to select your preferred style which will then appear in the value field alongside
Width – to change the value of the line, left click on the Width label which will turn blue. Left click the value field alongside and use the back space key to delete the existing value, and replace with a new value. The default is 3px, and any number higher than this will then increase the width of the line, whilst a lower number will decrease the width of the line. You do not need to enter ‘px’ after the number. Simply enter a whole number to change the width to your preferred appearance.
Any changes in color will also be reflected at the bottom of the indicator in the currency label. All the other currencies can be changed in exactly the same way.
Finally, if you wish to remove one or more currencies from the indicator, this can be done by changing the color of any currency line to match the background color. In this case any line changed to white would then effectively ‘disappear’ from the indicator.
Once you have made all the changes to the settings for the Quantum Currency Strength indicator left click the OK button to complete and update the indicator.
Resizing the indicator
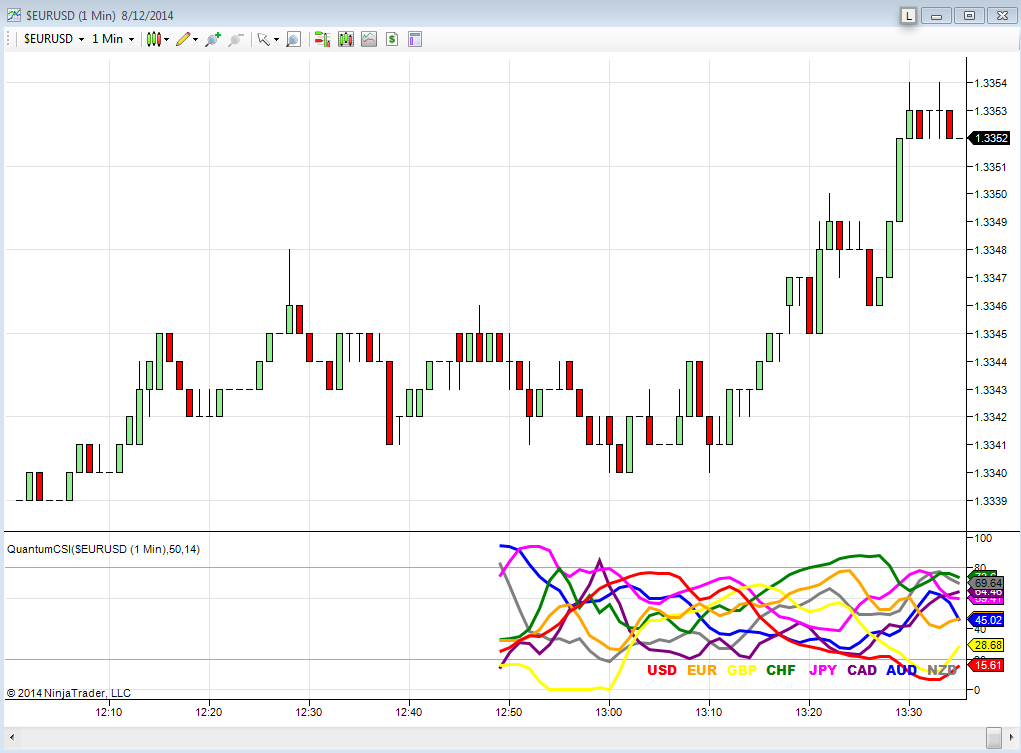
When you first apply the Currency Strength Indicator to the chart the indicator window may need resizing, and below is an example of how the indicator may look with now option changes applied and the default white background of a NinjaTrader chart.
In order to resize the indicator to the maximum height, hover over the horizontal line which separates the chart from the indicator, and you will see a small icon displayed of a solid black line with an arrow above and below. Once this appears, then left click HOLD and drag to resize the indicator window. Your Currency Strength Indicator will then look like this:
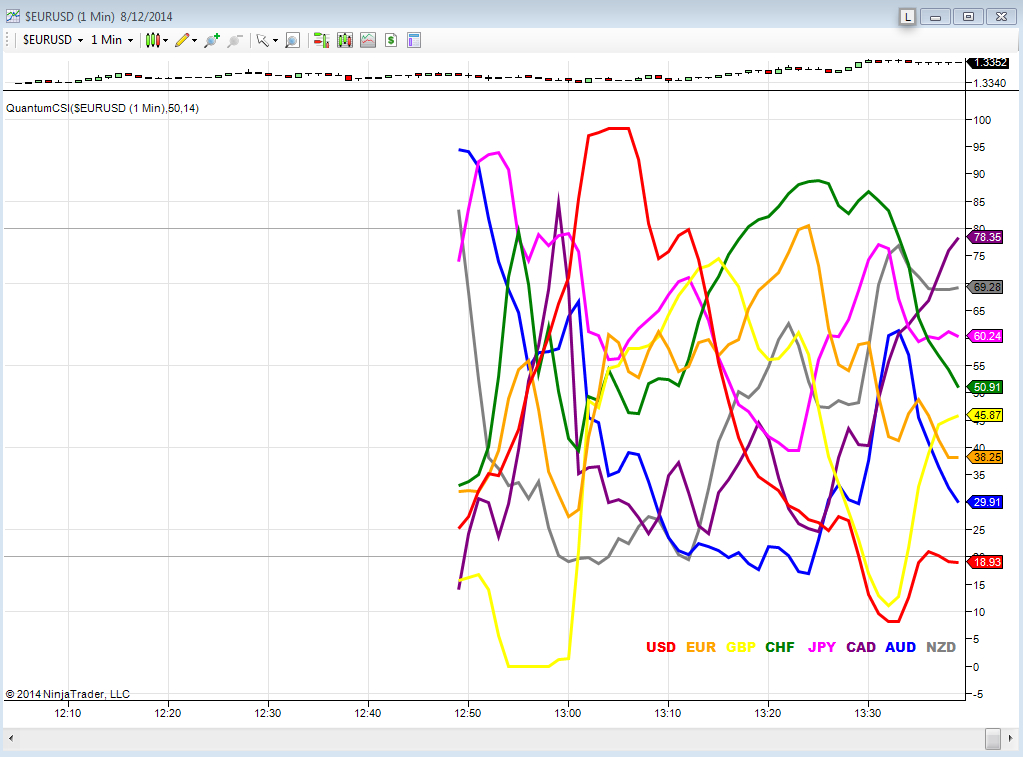
To remove the white space to the left of the indicator, hover your pointer over the right hand edge of the chart, and a white bar horizontal bar will appear with an arrow at either end. Left click and drag to the left which will then resize the window horizontally, and it will now look like this:
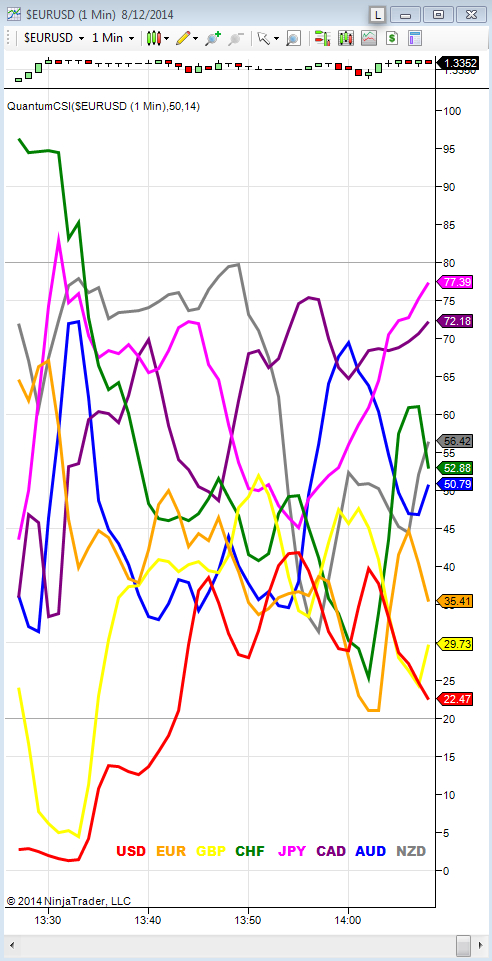
Finally there are two other steps to consider. First you can hide the chart at the top of the indicator by changing the color of the candles to merge with the background. Second you can enlarge the indicator by zooming in and out using the NinjaTrader toolbar and the + and – magnifying icons shown below:
Removing an indicator
These are the steps to remove an indicator from a chart:
Right click on the chart and then left click on Indicators from the pop up menu. Scroll down to the indicator you wish to remove and left click which will turn the indicator blue. This will then display the indicator window with its settings as shown below:
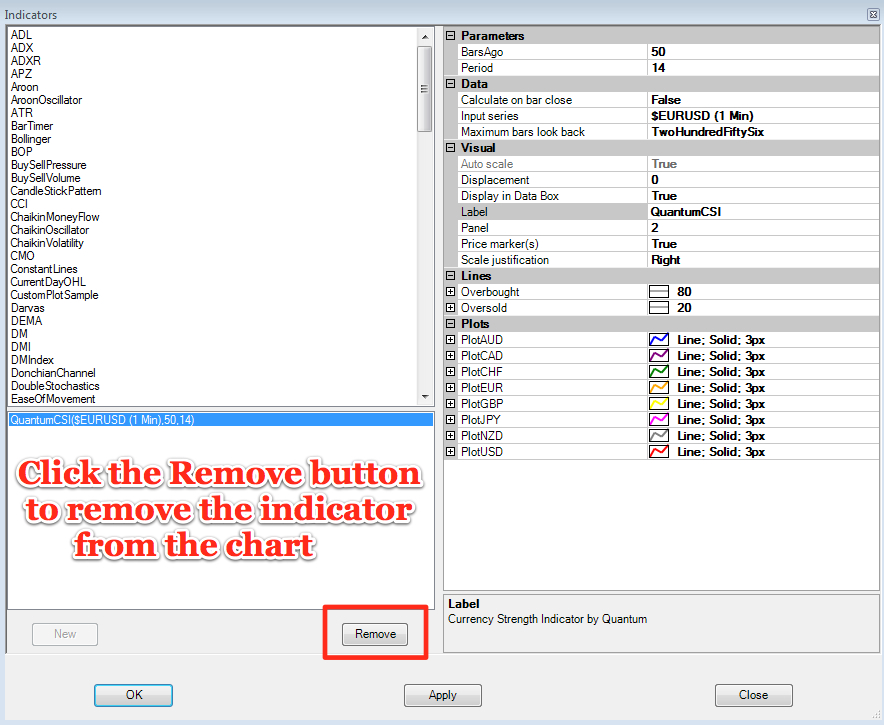
Simply left click on the Remove button as shown above, and the indicator will disappear from the list of indicators on the chart. To confirm left click the OK button to confirm and close the window.


