


Description
The Currency Dashboard is a bundled package of FOUR Quantum Trading indicators for trading forex :
- The currency strength indicator
- The currency matrix
- The currency array
- The currency heatmap
In our humble opinion the Currency Dashboard is an essential package for understanding currency flows and their associated strength and weakness, but you might wonder why we have created this very special bundled deal? The answer is simple. The forex market is a complex one, and to succeed you need a fast and efficient way of identifying individual currency strength and weakness, and from there how this is then reflected in the many pairs across the timeframes.
Now with just four indicators, you will be able to monitor every major currency, and every one of the 28 currency pairs across all the timeframes, from just one screen. No constant chasing from one window to another, no multiple screens or crammed workspaces. With this unique dashboard of trading indicators you will be able to see instantly every aspect of currency strength and weakness for currencies and currency pairs in all timeframes and at the click of a button. You can of course purchase them individually, but why bother, when you can have all four at such an amazing price!
The four indicators that make up this unique bundle are as follows:
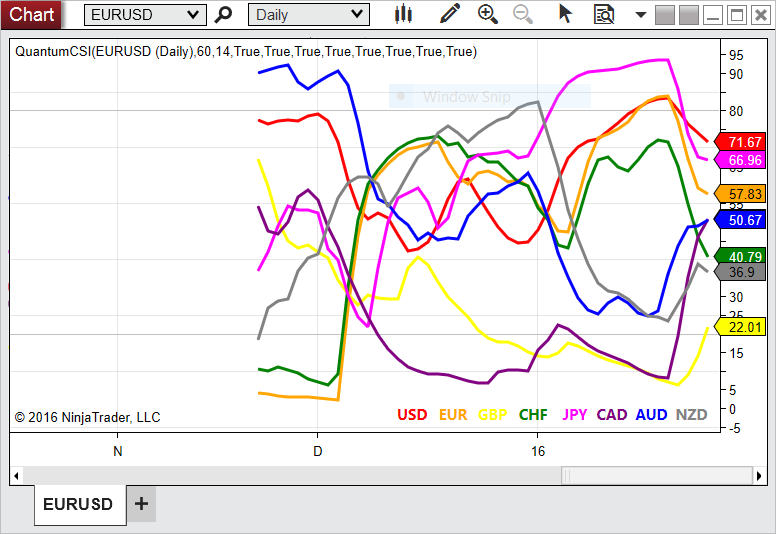
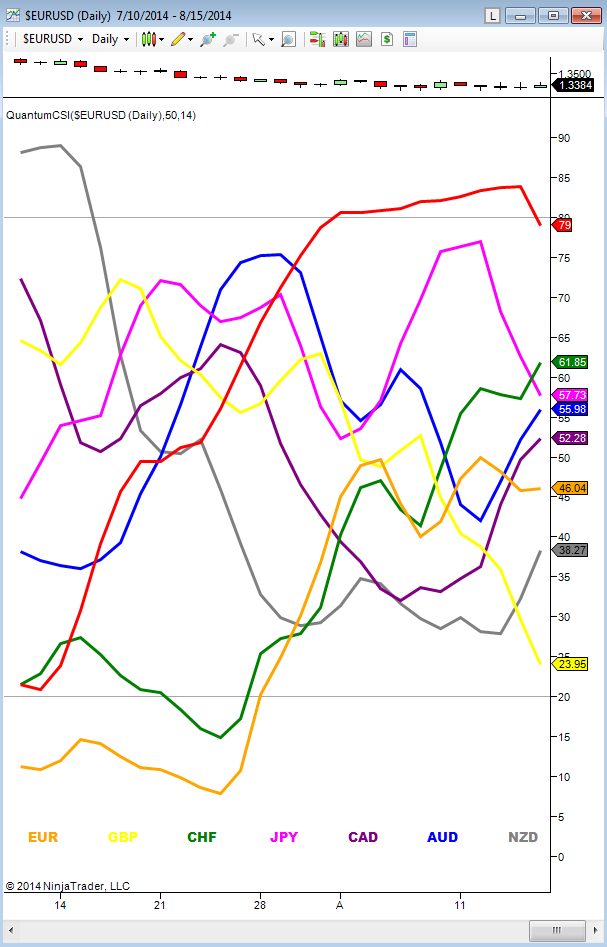
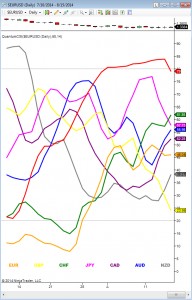
Currency Strength Indicator
The currency strength indicator disassembles the forex world into the building blocks of the market itself – the eight primary currencies. The indicator then tells you instantly which currencies are rising strongly, which are falling strongly, and those which are moving in a range. In addition and equally important, the indicator also reveals when a currency is approaching an overbought or oversold state, with a possible reversal in trend. The eight currencies are displayed as individual colored lines, making it quick and easy to spot trading opportunities. If one currency is rising strongly, and another falling strongly, then a strong trend is likely to be developing.
If two currencies are rising or falling together, that pair is likely to be in congestion, and may not be one to consider at present. Equally, if one currency is strongly overbought and another is strongly oversold, this is likely to be the signal for a potential reversal in trend. This gives you the opportunity to consider entering the start of a new trend early but remember this requires patience and a wider stop loss. Changing timeframes is a breeze – and within seconds you can see how all the currencies are performing, from 1 minute to 1 month and back again. Then it’s over to the charts for further analysis.
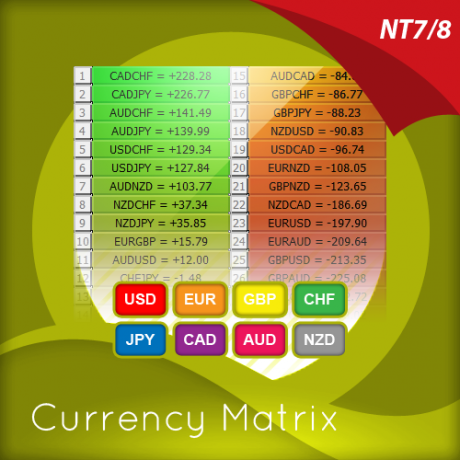
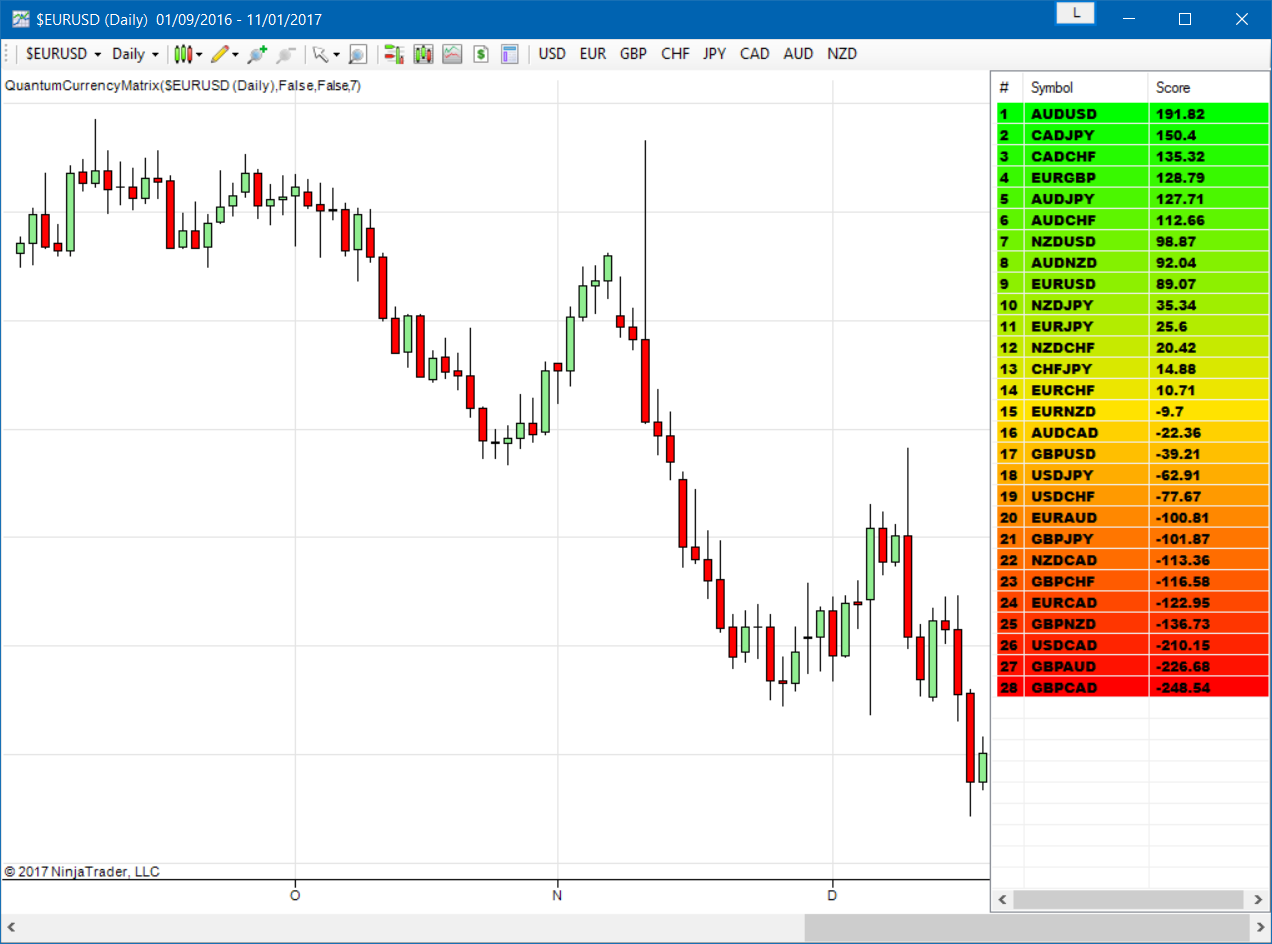
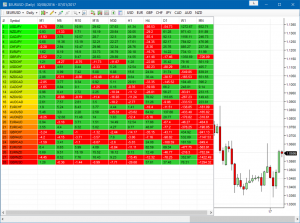
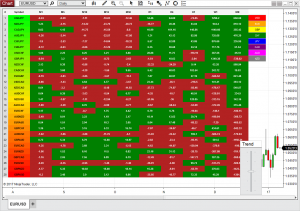
Currency Matrix Indicator
The currency matrix indicator ranks the 28 currency pairs in a leaderboard of strength and weakness in your chosen timeframe. Here you will see instantly those currency pairs which are rising, those which are falling, and those at the extremes of strength and weakness. In addition, by selecting one currency, the pairs in the currency complex are highlighted, which then confirms whether sentiment for the currency is universal. So for example, if the US dollar is being bought in one currency pair, we should expect to see buying of the US dollar in all the major currency pairs, which is then reflected in the leaderboard. In this example, we should see all those pairs with the US dollar as the counter currency falling on the leaderboard, and those with the US dollar as the primary currency duly rising. If so, then sentiment towards the US dollar is universal, and in this case we are joining the river of sentiment for this currency. In other words, we are joining the universal buying or selling.
However, if one of the US dollar pairs is out of step and moving in an opposite direction, several things are clear. First, if we trade this pair it is likely to be a higher risk. Second, this may be an opportunity to investigate, since this pair may ultimately rotate in the direction of universal flow. Third and last, this pair may be signaling the start of the rotation out of the current broad market sentiment and is the start of the end for the current bullish trend for the US dollar. And as with all the indicators, changing timeframes is very quick, so you can cross-check on the slower and faster times, before jumping in. Using a multiple timeframe approach applies just as strongly to indicators as to charts.
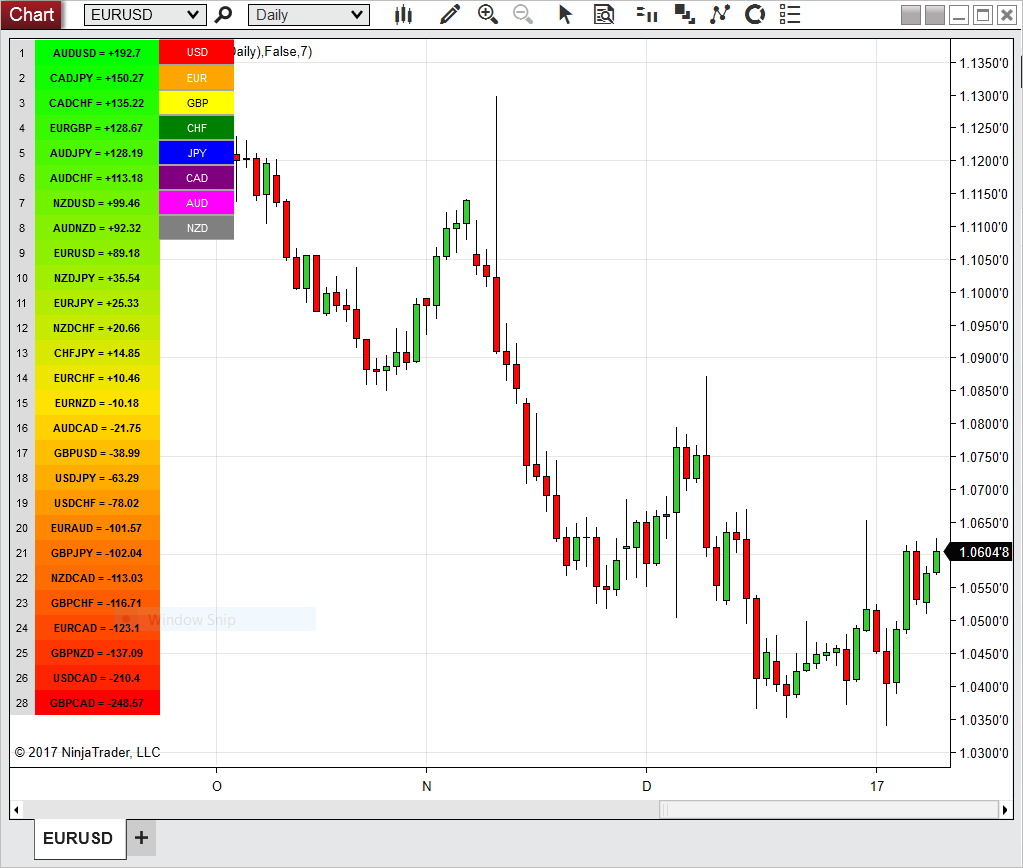
Currency Array Indicator
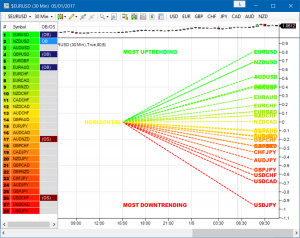
The Currency Array indicator takes you to the next level of your analysis of currency strength and weakness. Now you want to see the strength of the trend in all 28 pairs, which is what this indicator is all about.
The Currency Array reveals instantly, graphically and in all timeframes which currency pairs are trending higher and lower with the greatest speed and momentum. And as you might expect, it also displays those currency pairs which are currently in a congestion phase with little or no trend. As the trends develop from the center outwards, so the angle of the trend line increases constantly, until it reaches an extreme on one side or the other of the array. As a pair begins to move away from the center, and the angle of the array begins to increase, so the trend is developing and an opportunity to join the trend as it picks up momentum. Indeed one of the beautiful features of the array is you will actually see momentum instantly and developing in real-time as the currency line sweeps higher or sweeps lower, gathering pace as it does so. Think of this rather like the pendulum on a clock. First sweeping one way, and gathering speed, before slowing and reversing to change direction, and then gathering speed once more.
And just like our pendulum, once the line representing the currency pair begins to reach an extreme, then we have the possibility of a reversal in trend and an opportunity to jump into a position early.
And this is where a further feature of the indicator kicks in. As a currency pair approaches an extreme, the indicator signals a potential overbought or oversold state being reached. First with a darker color signal and then confirmed with a brighter color. At the same time, the array line itself changes from a dashed display to a solid line. It’s like watching 28 charts simultaneously but from one screen!
Finally, the indicator delivers the third advantage with all the pairs duly ranked from those most heavily bearish to those most strongly bullish. And of course, the array will tell you instantly if the sentiment for one currency is universal. If it is, then the pairs will all be aligned. If it is not, you will see divergence on the array, and the simplest example here is with the Japanese yen. If all the yen pairs are on one side or the other of the midpoint, then the sentiment is universal across the market. If they are not, then one or more of the pairs is out of balance, and like the currency, matrix may be signaling rotation out, or rotation into the yen. Whichever is the case, it is either a risk to be avoided or an opportunity to be grabbed.
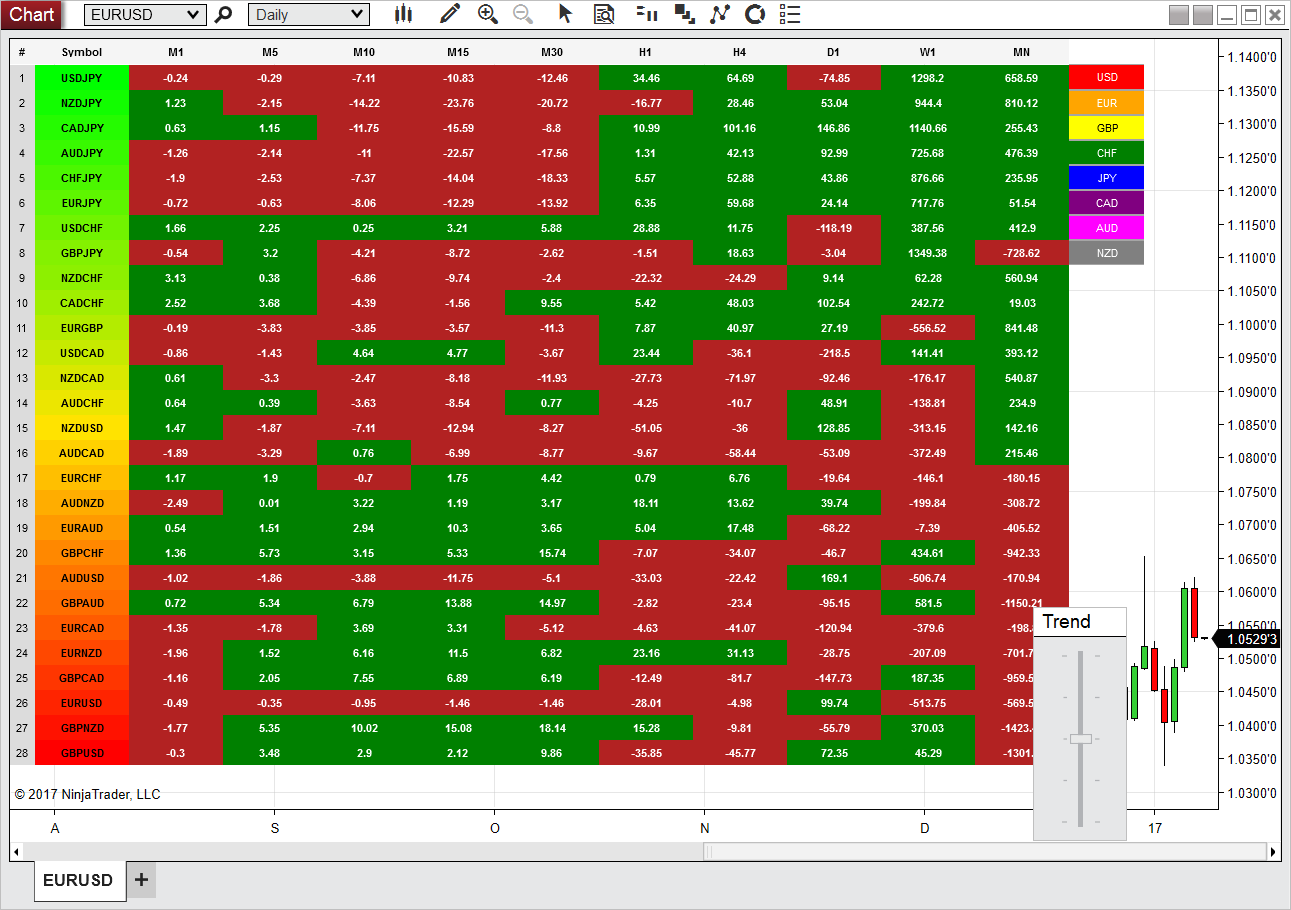
Currency Heatmap Indicator
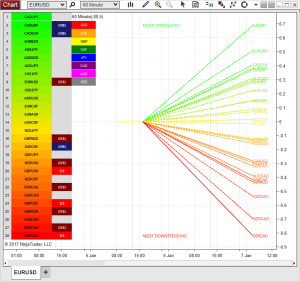
And finally to complete your dashboard comes the Currency Heatmap indicator which delivers a two-dimensional global view of risk and sentiment on one chart. Vertically in the ranking table, and then horizontally across the horizon of time. Instant, simple and powerful.
The table itself displays whether a pair is bullish or bearish pulling the data from the Currency Matrix. This gives us an instant view of sentiment for the pairs. If the performance score for a pair is negative then it is bearish, and each cell of the table is painted red. If the score is positive then it appears green. Viewed across the timeframes this then gives you a real-time view as sentiment strengthens or weakens. You can think of this as the ripples in a pond that reflect sentiment rippling through the market. As sentiment changes in one timeframe, you are then looking for it to change in another, and perhaps highlighting the start of a longer-term change in the trend. If the 1-minute changes color, followed by the 5 minutes and perhaps the 15 minutes, then this is signaling a strong change in trend which may develop still further and out towards the slower timeframes in due course.
As traders, we all understand the significance and importance of time and timeframes, as sentiment in a slower timeframe will always require a more significant change in the trend to move this from bullish to bearish or vice versa. In other words, time carries weight in the sense that a trend on an hourly chart will be more dominant than the trend on a 1-minute chart. The indicator takes this weighting into account when calculating the ranking scores, thereby revealing a truly global view of the relative strength or weakness of the 28 currency pairs.
This is the second concept associated with the indicator which is that of the vertical ranking of the pairs. In other words the global ranking of the currency pair relative to all its peers. So for example, if a currency pair is ranked at the top of the ladder, then relative to all the other 28 pairs, and based on a weighted calculation across the nine timeframes, that currency pair is the most bullish in the market at present. Equally, the pair at the bottom of the ladder is the most bearish. In both cases, this ranking will be backed up by the weight of sentiment across the heatmap itself. In the first case, a greater number of cells will be green, and in the latter, a greater number will be red. For those currency pairs moving higher or lower in the ranking ladder, the associated cells will also be changing, reflecting changes in sentiment across the timeframes, and either supporting a move higher or confirming a move lower.
For a pair to move up the ranking ladder, an increasing number of cells will need to transition from red to green, as the rippling change in sentiment drives the currency pair higher. Equally, for a currency pair to move lower in the ladder, an increasing number of cells need to change from green to red from the faster to the slower timeframes.
The Currency Heatmap is all about context and risk assessment of the trend in the different timeframes. In other words, a micro and a macro view. The micro view is of each timeframe, and how the currency pair is performing across the time horizon. The macro view is then of the currency pair and its relative ranking. As a forex trader, the indicator delivers the complete view from micro to macro and back again, allowing you to assess risk. If a pair is rising and bullish on the ranking ladder, yet some bearish sentiment is evident on the faster timeframes, then you are trading against the dominant trend. But in the same example, if the faster timeframes are signaling the same bullish sentiment, this represents a different proposition.
In summary, the Currency Heatmap is simply that – a heatmap of the currency world from the micro to the macro and on a single chart. Together with the Currency Strength indicator, the Currency Matrix, and the Currency Array, these four indicators combine to deliver a complete, unique, and all-encompassing approach to the complex world of trading forex. You can of course buy them individually….but then why would you, when you can purchase all four together.
So why not grab all four now and start trading with confidence based on the knowledge delivered from your very own currency dashboard.