Introduction
Many forex traders are familiar with the concepts of volume price analysis as enshrined in Wyckoff’s three laws of effort and result, cause and effect and supply and demand. This is the linear relationship between volume and price. Now with the Volume Point of Control, VPOC for NinjaTradethis relationship is taken to the next level adding the concept of time and inspired by the ideas behind the market profile.
The Quantum Volume Point of Control, or VPOC indicator blends ALL THREE of these important aspects of trading into a single powerful and visual indicator.
The Quantum VPOC indicator takes the analysis of volume and price to a higher level, which both complements and expands the VPA relationship. Whilst the Quantum tick volumes indicator considers the relationship between a single volume bar and its associated candle on the price time x-axis or groups of candles and volume bars, the Quantum VPOC indicator analyses the density and intensity of volume over time against price. In other words, the volume price relationship on the y axis. It does this in three distinct ways as follows:
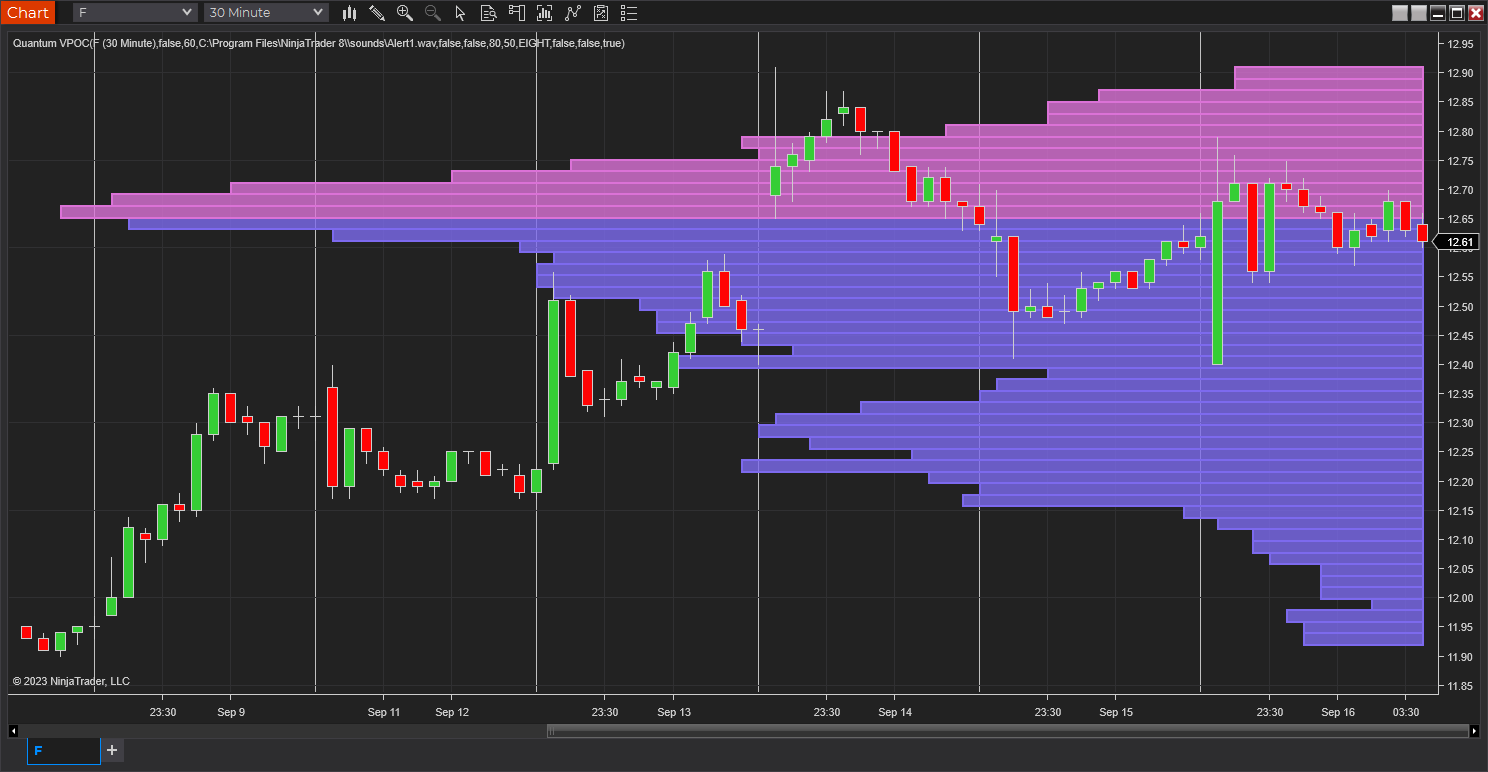
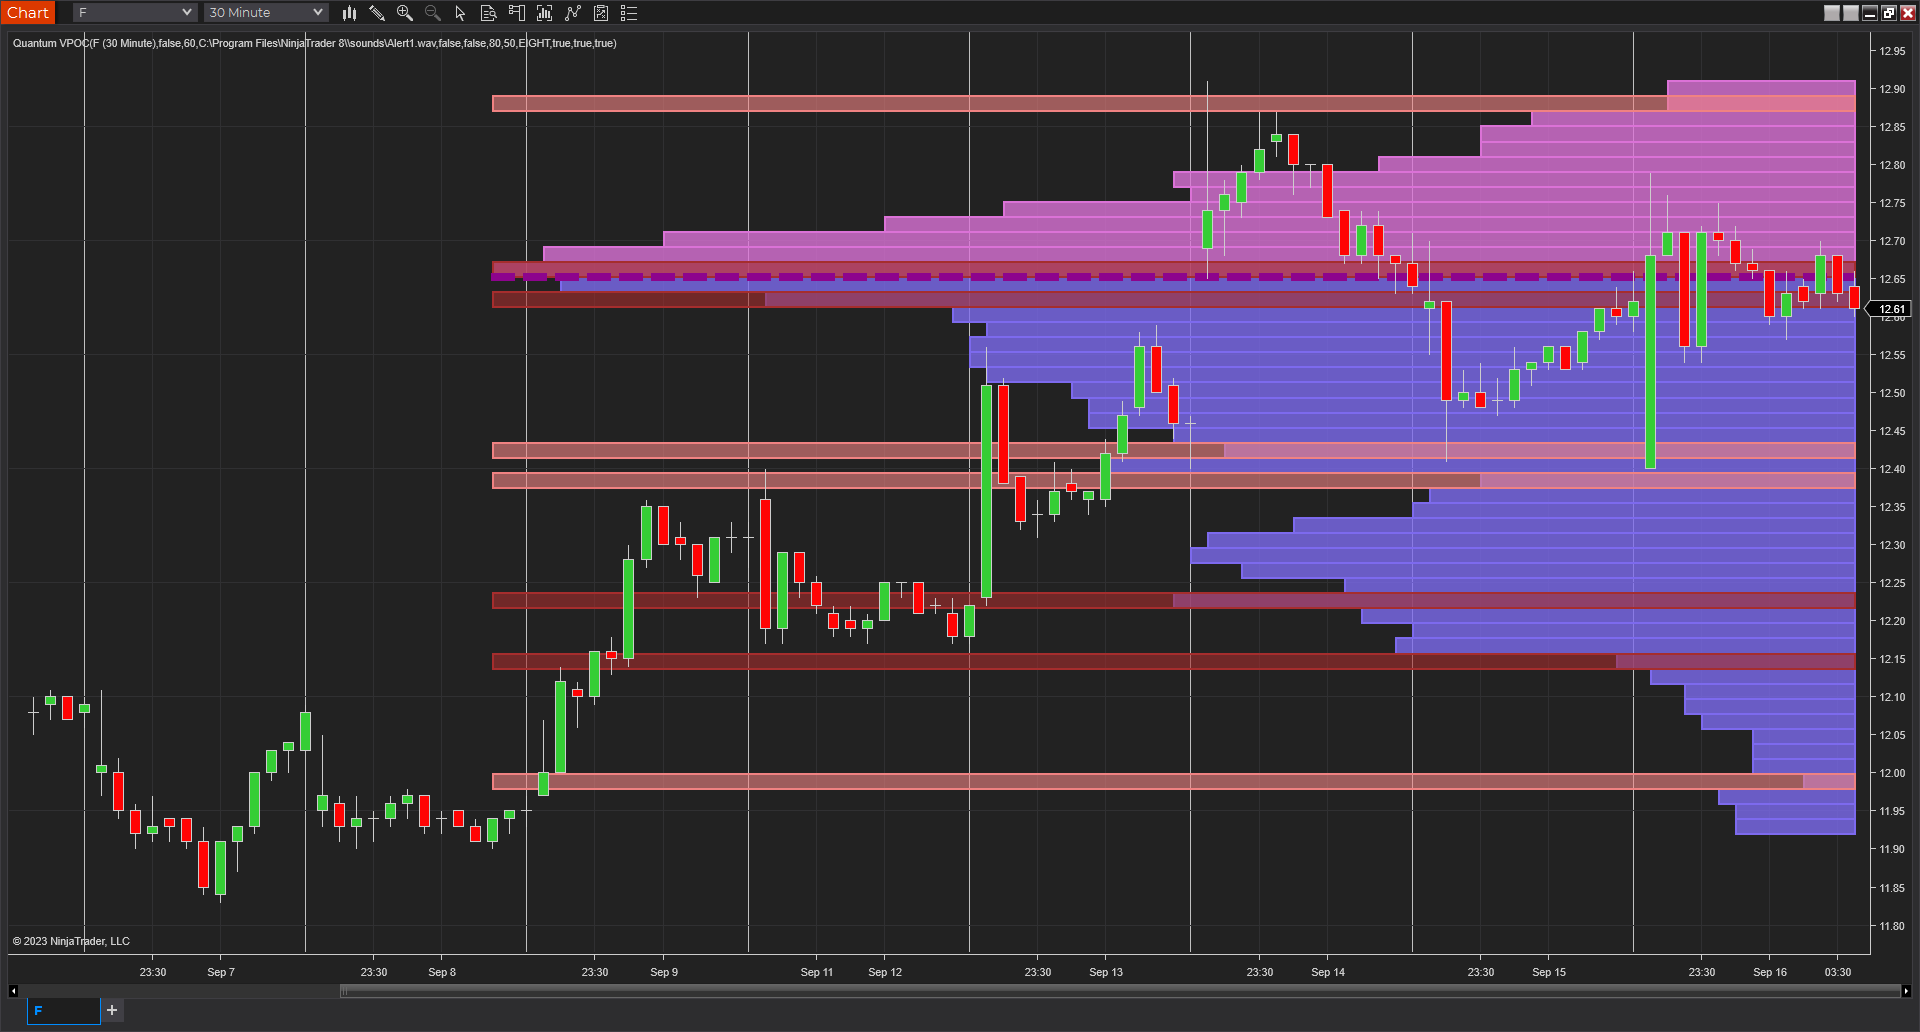
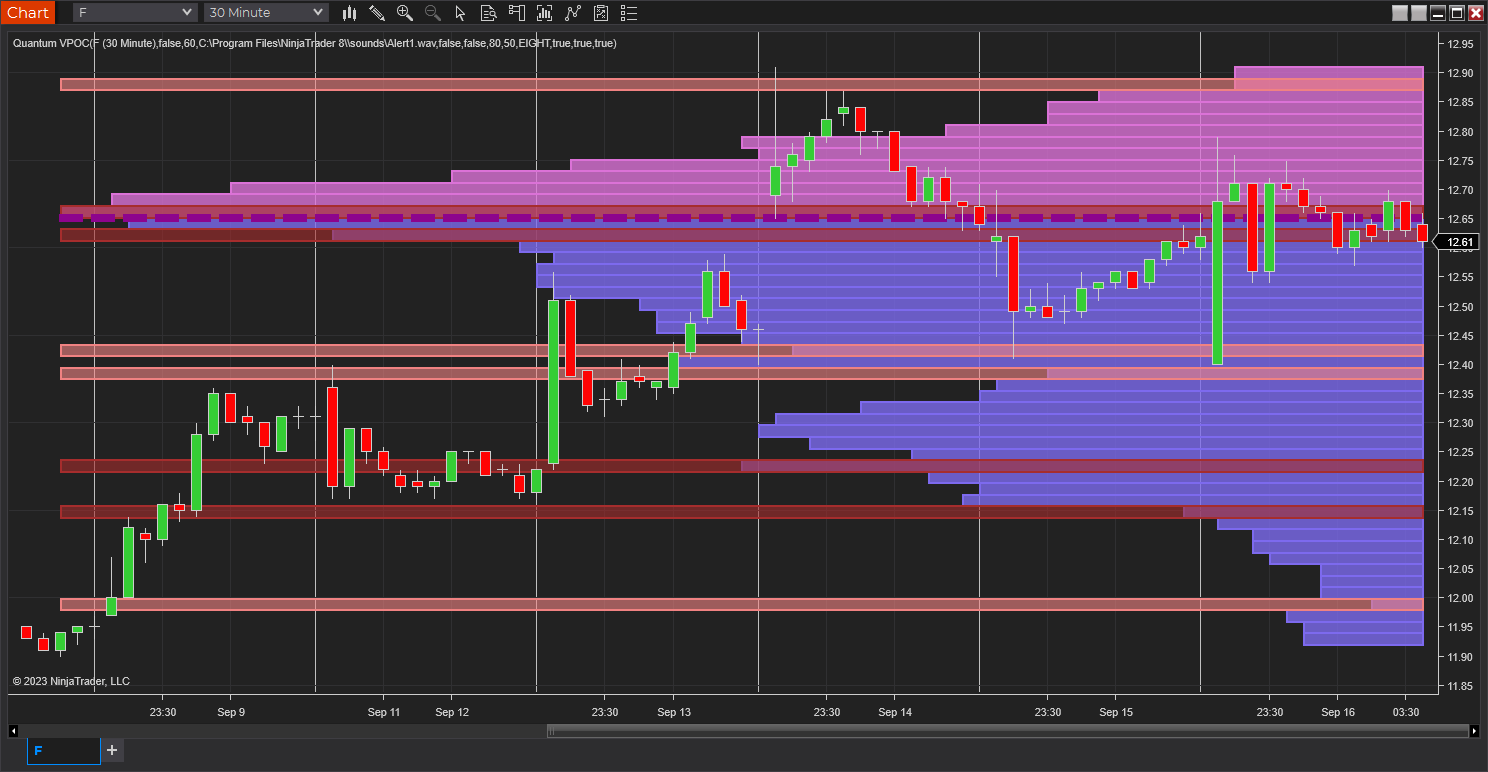
First, the Quantum VPOC indicator constructs the Volume Profile from a set number of bars in history to the most current bar. The Volume Profile is then presented as a vertical histogram shown at the right edge of the chart – a stack of horizontal bars of varying lengths, but of equal height representing the amount of activity at each price level.
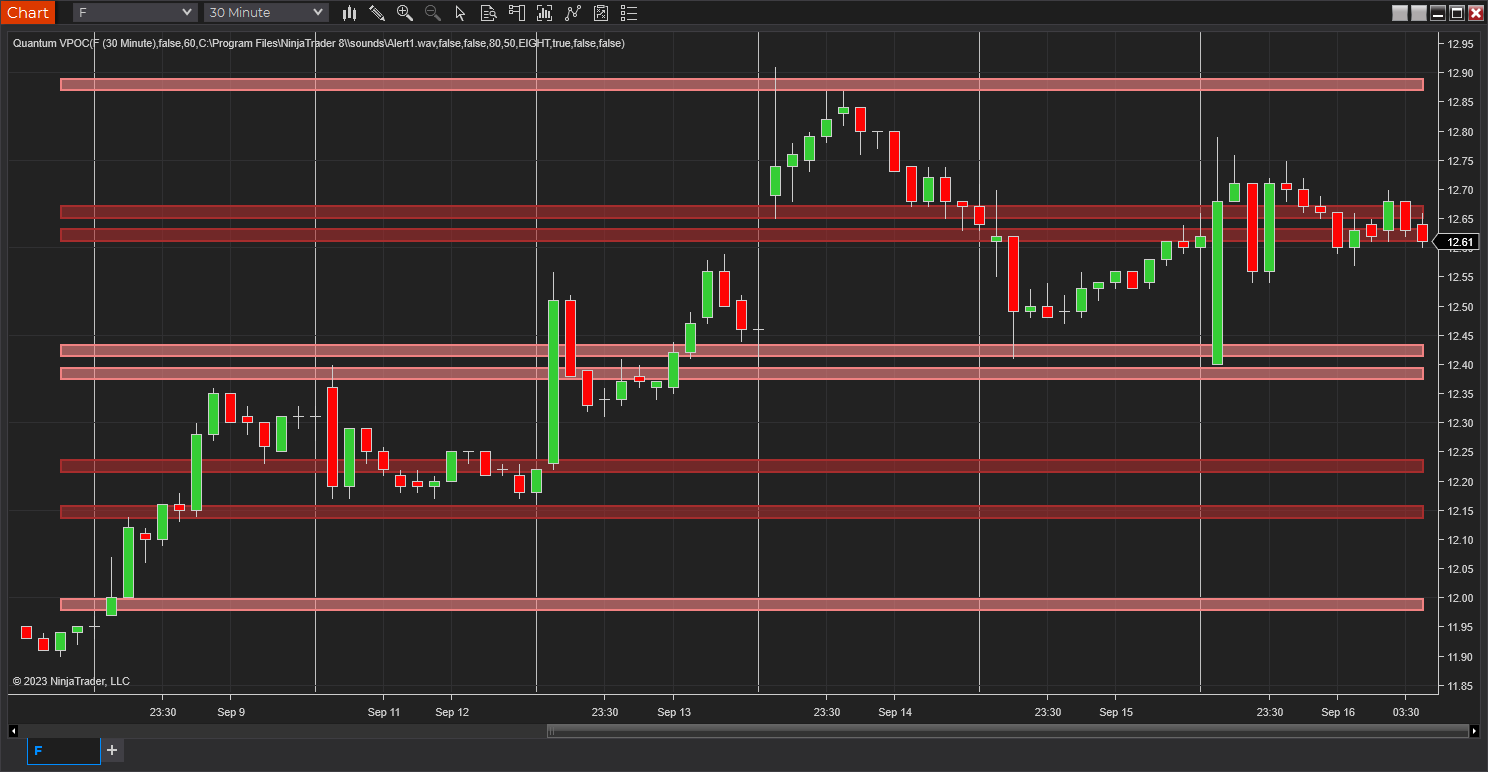
Second, the Quantum VPOC analyzes the Volume Profile to find the key price levels where activity is strong and rising, or weak and falling. In other words, the indicator looks for peaks (long bars) of the Volume Profile where price tends to be attracted as these are areas where price was previously accepted. These are called High Volume Nodes (HVN). The indicator also looks for troughs or valleys (short bars) of the Volume Profile where price tends to be repelled as these are areas where price was previously rejected. These are referred to as Low Volume Nodes (LVN). Both types of price level act as precise zones of support and resistance and as such are projected across the chart within the given period.
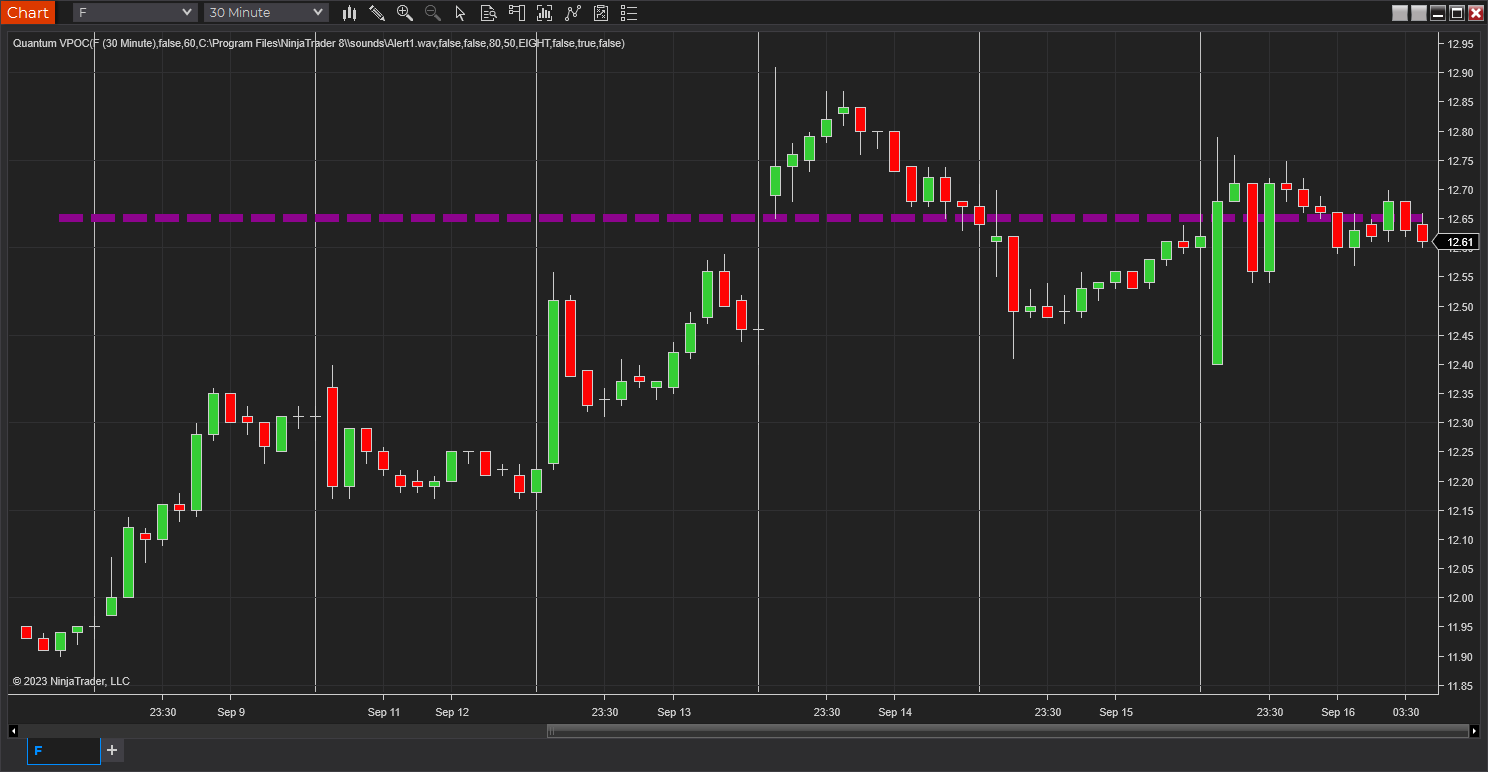
Third, the Quantum VPOC indicator looks for the Highest Volume Node or the highest peak in the Volume Profile and marks it as the Volume Point of Control – the price level which acts as the fulcrum from which price pivots. The indicator completes its calculations and updates as each new volume bar is delivered.
The result is a chart revealing the overarching influence of volume at price, coupled with time.
The Quantum VPOC indicator for NinjaTrader displays several key pieces of information on the chart as follows:
- Volume Profile – this appears as a histogram of volume on the vertical price axis on the right-hand side of the chart. The peaks and troughs are clearly displayed highlighting both High and Low Volume nodes.
- High volume node (HVN) – this is where we have a bulge in the volume profile generally because of an extended phase of price congestion. As a result, as the market approaches these regions on the chart price action is likely to become waterlogged with further congestion likely with the node acting as a strong area of support or resistance. As we have seen a strong acceptance of price at this level in the past, this is likely to be repeated with the market swinging in a range. Ultimately the market may reverse off these levels, with any move through then confirming the current sentiment.
- Low volume node (LVN) – this is where we see low volume in the volume profile. In these regions, the market has only paused temporarily – in other words a region where price has been rejected in the past. As such we are likely to see the market move quickly through these regions with little in the way of resistance or support acting to prevent a further advance of decline in price. The current sentiment is likely to continue and build quickly through these levels.
- Support and Resistance Zones – these are drawn at the High and Low Volume nodes to highlight the various HVN and LVN levels on the price axis.
- Volume Point of Control Line – this is drawn as a single line on the highest volume of the High Volume Node in the timeframe and clearly defines the tipping point of sentiment. This moves dynamically and represents the fulcrum of market sentiment where price has reached agreement, before moving on. If it is above the price action, then the current market sentiment is bearish. If it is below the current price action, then the current market sentiment is bullish. The VPOC Line reveals this balance simply, quickly, and clearly allowing you to judge market sentiment with accuracy and confidence.
As with all the Quantum Trading indicators, the VPOC indicator is dynamic, constantly changing and updating to reflect the relentless shift in sentiment as the market moves from bullish to bearish and back again. The indicator works in all timeframes and provides a powerful and much deeper understanding of support and resistance through the prism of volume and the associated High and Low Volume Nodes, with the Point of Control itself, acting as the fulcrum of the market.
Installation
Open your NinjaTrader 8 platform and select a chart.
Right click the chart to bring up a menu which looks like the following image:
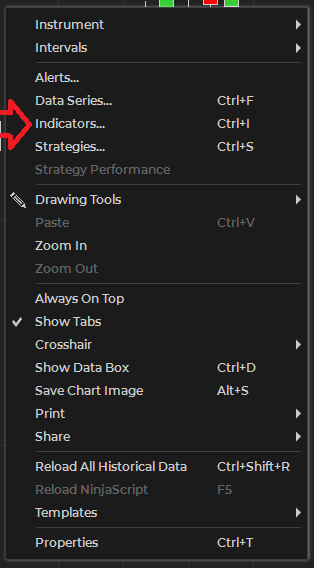
Select Indicators… which will open the following window. Alternatively, you can open this window by clicking the Indicators button in the chart toolbar or by pressing Ctrl + I while focused on the chart.
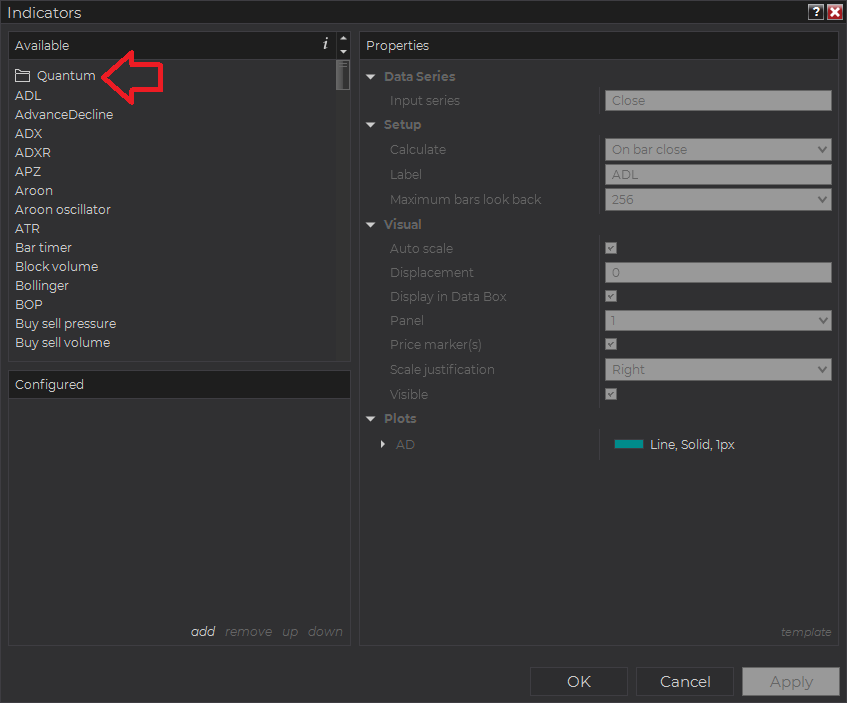
In the Indicators window under Available section, go to Quantum > Quantum VPOC and click it to select the indicator. Once selected, click “add” under the Configured section which will put it on the list of active indicators to be added in the chart.
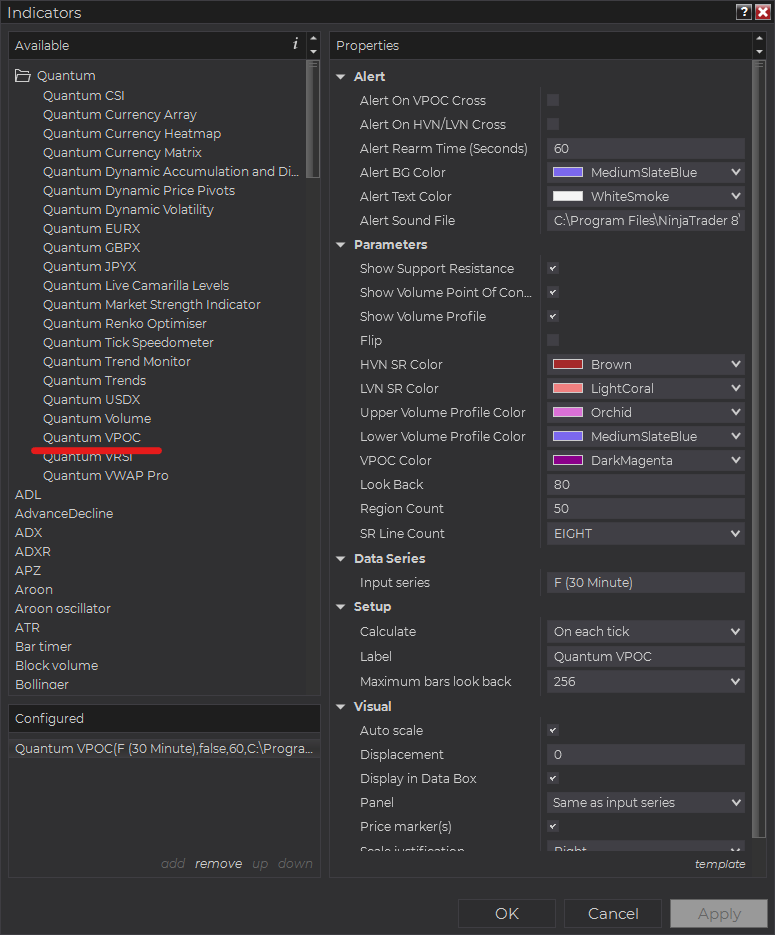
Before clicking the OK or Apply button to complete, the indicator has several configurable options. You can click the Apply button at any time, and this will apply any changes you have made to the indicator without closing the window. This will allow you to see the changes you have made to the indicator, without closing with the OK button or the Cancel button.
Configuration
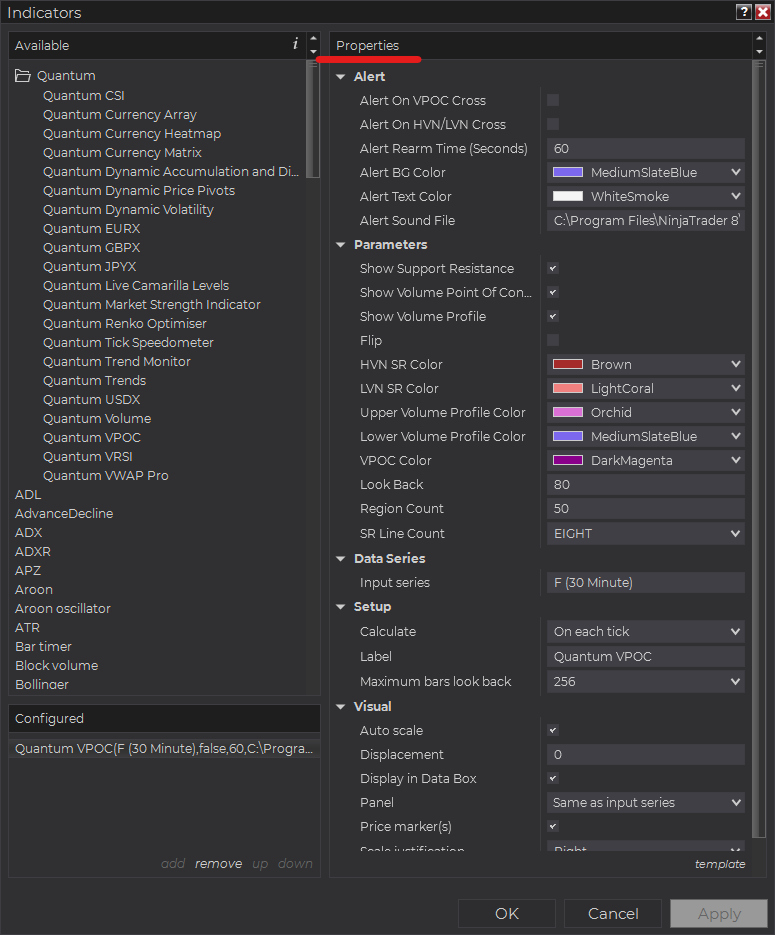
All user input can be configured at the right-hand side of the Indicators window under the Properties section. These are the default settings when you add the indicator in a chart.
Main Settings
Alert
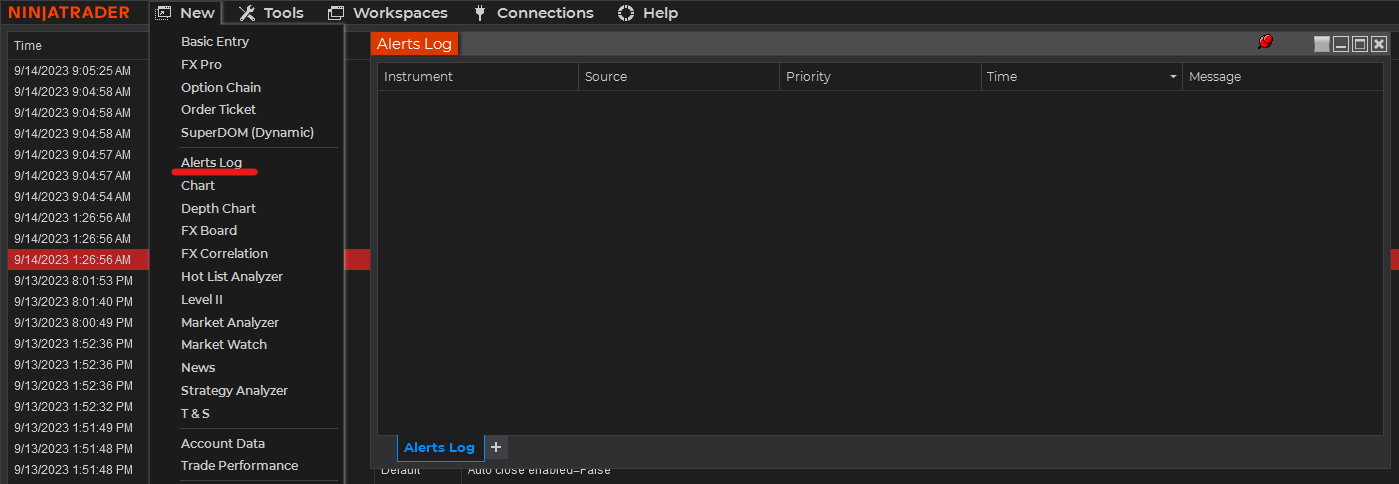
The following settings affect the indicator’s alert notifications displayed in the Alerts Log. You can open the Alerts Log from your NinjaTrader 8 client’s menu bar in the main window at New > Alerts Log.
Alert On VPOC Cross
When enabled, the indicator sends an alert notification in the Alerts Log when the current price crosses the VPOC line.
Alert On HVN/LVN Cross
When enabled, the indicator sends an alert notification in the Alerts Log when the current price crosses High Volume Node (HVN) lines or Low Volume Node (LVN) lines.
Alert Rearm Time (Seconds)
This adds a delay to the next alert notification, expressed in number of seconds.
Alert BG Color
This setting allows you to customize the background color of the indicator’s messages as they appear in the Alerts Log.
Alert Text Color
This setting allows you to customize the color of the text as the indicator’s messages appear in the Alerts Log.
Alert Sound File
You can change here the sound file the platform uses when this indicator triggers an alert. By default, it uses the Alert1.wav file packaged with your NinjaTrader installation. Please make sure that the file is supported and the absolute path to the sound file is entered correctly.
Parameters
Show Support Resistance
Shows or hides the support and resistance areas in the VPOC.
Show Volume Point of Control
Shows or hides the VPOC line.
Show Volume Profile
Shows or hides the volume profile element in the VPOC.
Flip
Changes the orientation of the VPOC to the left side, projecting from the Look Back bar.
HVN SR Color
Sets the color of support/resistance areas that are High Volume Nodes.
LVN SR Color
Sets the color of support/resistance areas that are Low Volume Nodes.
Upper Volume Profile Color
Sets the color of the upper half of the volume profile. The upper half of the volume profile sits above the VPOC line.
Lower Volume Profile Color
Sets the color of the lower half of the volume profile. The lower half of the volume profile sits below the VPOC line.
VPOC Color
Sets the color of the VPOC line.
Look Back
This setting defines the scope of the indicator. The objects generated by the indicator such as the support and resistance zones, volume point of control, and the volume profile will cover bars from the Look Back bar up to the current bar. For example, the Look Back is set to the default value which is 80 bars. The indicator will calculate the volume profile from the 80th bar in the bar history to the most current one.
Region Count
This setting allows you to refine or simplify the definition of the volume profile which is composed of 80 bars by default.
SR Line Count
This setting allows you to choose the number of support and resistance zones or the HVN and LVN areas in the volume profile as analyzed by the indicator. You can choose from 2,4, 6, 8, 10, 12, 14, 16, and 18 S/R lines and the default count is 8.
Other Settings
Data Series
Input Series
Opens the indicator Input Series dialogue which allows you to select the source of data for your indicator’s calculations.
Setup
Calculate
Sets the frequency at which the indicator performs its calculations.
Label
The label of the indicator’s instance displayed on the chart.
Maximum bars look back
Determines the maximum number of bars the indicator can look back to perform calculations on historical data. This is set to 256 by default (the most memory-friendly setting), but it can be changed to “infinite” to allow for a greater look back period.
Visual
Auto scale
When enabled, the indicator will be included in the chart panel’s vertical automatic scaling.
Displacement
Sets the number of bars by which to displace the indicator plots.
Display in Data Box
Enables or disables the inclusion of the indicator’s plot values in the Data Box
Panel
Sets the panel in which the indicator is plotted. If you select “Same as input series,” the indicator will be linked to the Input Series and automatically move if the Input Series is modified to a different panel.
Price marker(s)
When enabled, the indicator value is plotted in the axis selected under the “Scale Justification” property.
Scale justification
Sets the scale on which the indicator will be plotted. Possible values are “Right,” “Left,” and “Overlay”.
Visible
Enables or disables visibility and function of the indicator on the chart.
Unloading the indicator
Here are the steps to remove the indicator in the chart and in the Alert Log.
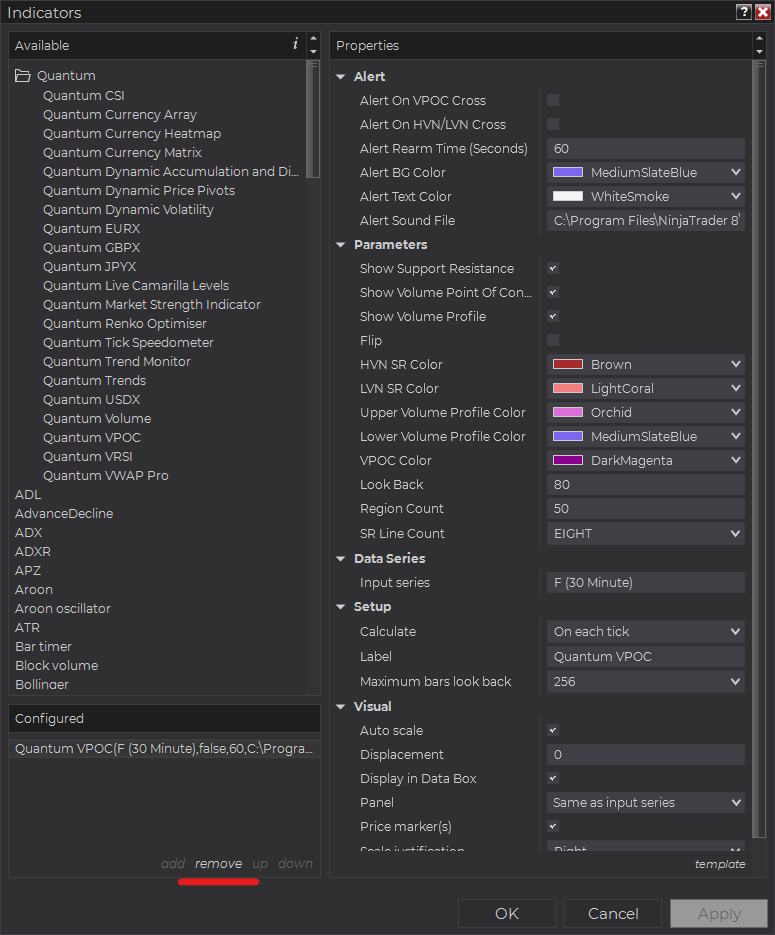
Right-click on the chart then select Indicators… from the menu. Select Quantum VPOC from the Configured section and click “remove” then OK to confirm and the indicator should be unloaded from your chart.
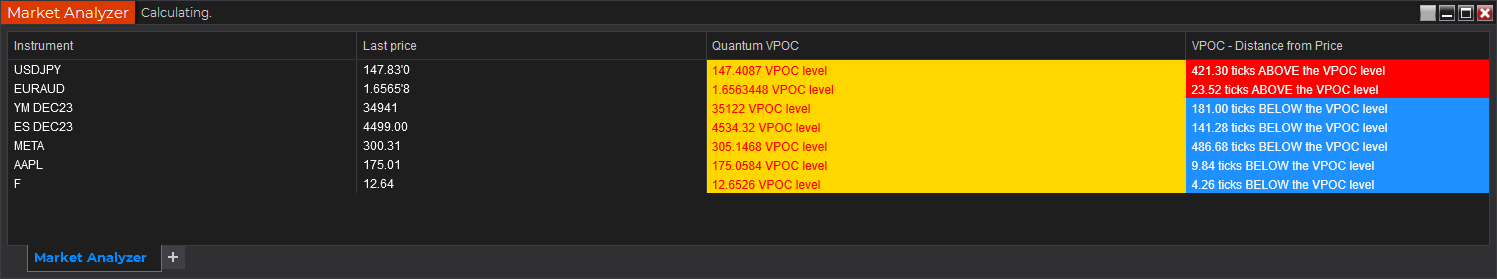
Using the Quantum VPOC in the NinjaTrader Market Analyzer
Valid Rows
The Quantum VPOC indicator works in any instrument with historical volume data.
Adding the Quantum VPOC as a Market Analyzer Column
Here are the basic steps to add the Quantum VPOC in the Market Analyzer:
Make sure valid rows are present in the Market Analyzer window.
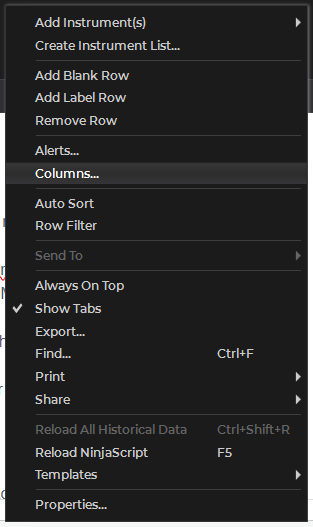
Right-click anywhere in the Market Analyzer window then select “Columns…” in the context menu.
The Columns window appears. In the Available section, go to QuantumMarketAnalyzerColumns folder then double-click the Quantum VPOC to add the indicator as one of the columns in the Market Analyzer.
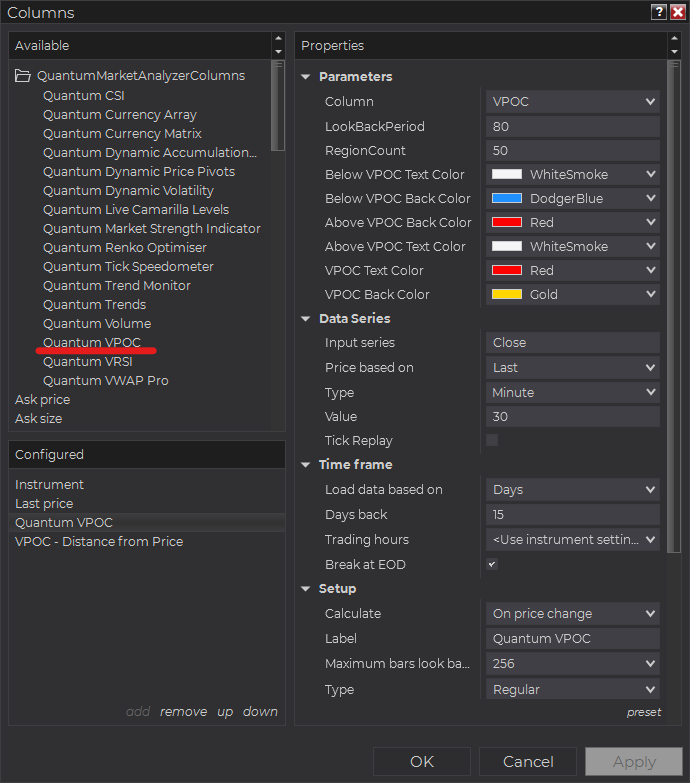
Select the type of information you like to display using the Column drop down menu under the Properties section of the indicator.
Set the timeframe of the indicator in Properties > Data Series section with the following user inputs:
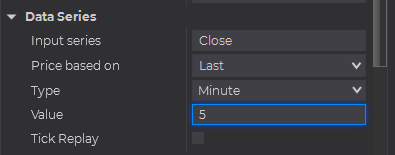
Type – select a time-based series such as Minute or Day
Value – set the interval for the type of series selected above
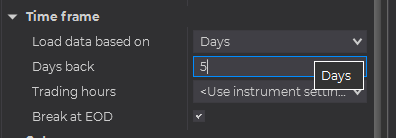
When running the indicator in timeframes less than Hourly intervals, please configure the “Load data based on” property to “Days” and the “Days back” property to the default value of 5 days to ensure that there is enough data for the indicator to work with.
After you have finished all your configurations, click OK to confirm your chosen settings and to add the indicator as a column in your Market Analyzer window.
Column Options
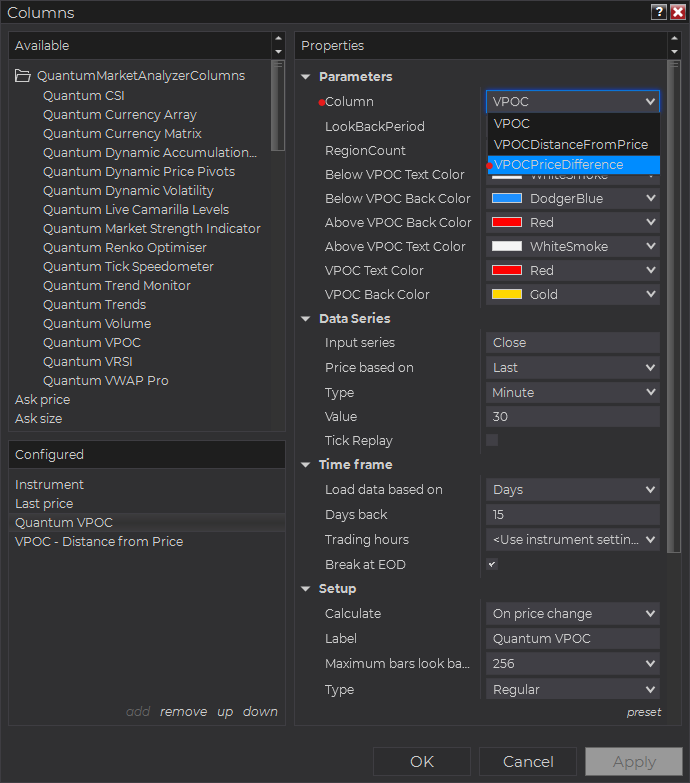
The Quantum VPOC is a multi-faceted indicator that can display different types of signals which can be selected through its Column drop down menu found under the Properties section. You can customize the indicator’s function in the Market Analyzer by selecting any of the options enumerated below.
- VPOC – displays the current price level of the VPOC line.
- VPOCDistanceFromPrice – displays the “distance” of the current price from the VPOC price level. The distance is expressed in Tick Size (see NinjaScript API).
- VPOCPriceDifference – displays the difference between the current price and the price level of the VPOC line.
Tip: You can change the Label property of the column to describe what type of signal you choose to display.


