General – getting started
The Quantum Tick Speedometer indicator has been designed with one simple objective. To place the power of tick trading in your hands. It does this in several unique ways.
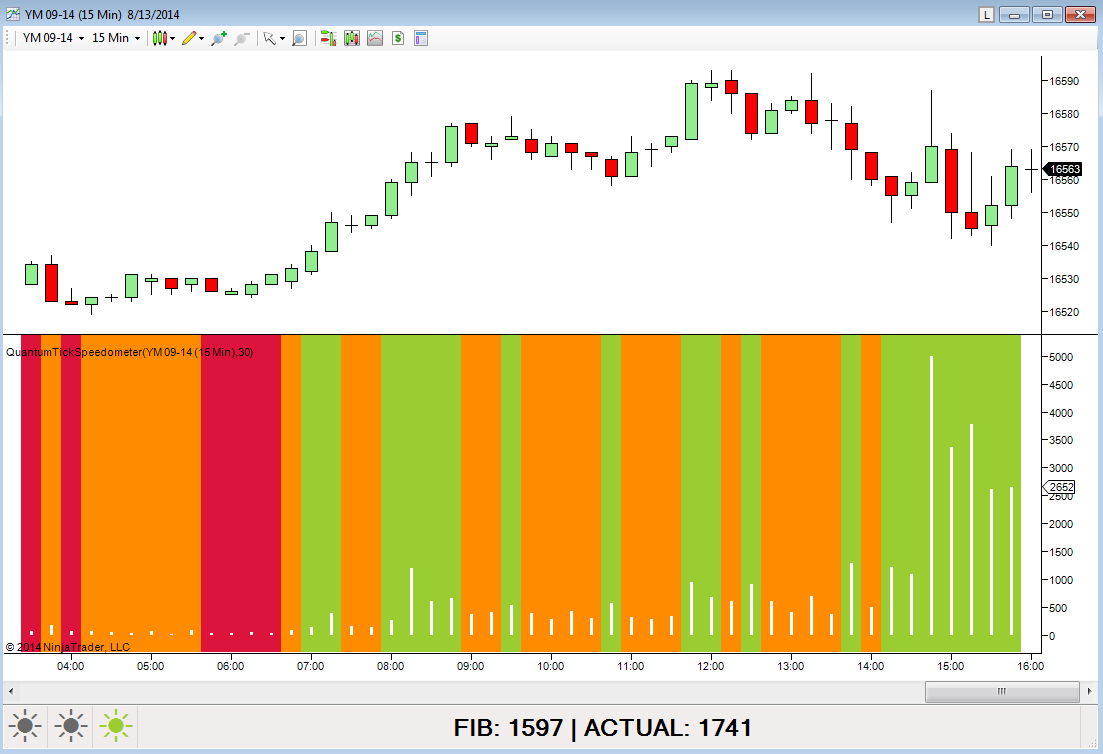
First, the indicator is dynamic. This is not a static indicator which only displays data based on history. It is dynamic, counting and displaying tick activity in realtime as the market moves tick by tick, and minute by minute.
Second, the indicator acts as the bridge between time and tick. Apply the indicator to a time based chart and it will display the current tick speed for that instrument, at that precise moment in the session. It’s a time tick converter if you like. So for example if you are an index trader and prefer the 1 minute chart, apply the indicator and this will then display the equivalent tick speed for the index dynamically. This will change throughout the trading session allowing you to see the momentum changes as tick speeds increase or decrease accordingly
Third, the indicator displays both the actual and the closest Fib number. This gives you the option to trade using the actual tick speed, or the closest Fibonacci number to the actual. The Fibonacci number will change less often requiring fewer changes to the tick chart setting, whilst the true number will change more frequently. It’s your choice.
Fourth, the indicator includes a traffic light system which gives a visual signal of whether the tick speed for that timeframe is speeding up or slowing down. When the red traffic light is displayed it’s a strong signal of low volatility, and a warning signal of possible danger ahead as the price action moves into congestion.
Fifth and last, the indicator displays the levels of tick activity graphically, showing those areas of high medium and low volatility.
The indicator works in all timeframes from seconds and minutes, and with all instruments and markets. So whether you are a scalping trader on the ES E-mini or other indices, or perhaps a swing trader of commodities, stocks, or bonds, the indicator will deliver all the tick information you need to start trading with the professionals.
The Quantum TickSpeedometer indicator finally puts the power of tick trading within your grasp. No more guesswork, no more asking other traders – soon they will be asking you! The Quantum TickSpeedometer indicator is easy to install and configure, then presents all the tick data for you simply and graphically. All you have to do is start trading and join the professionals today.
Installation
Open your NinjaTrader platform and select a chart
- Right click
This will open the following window:
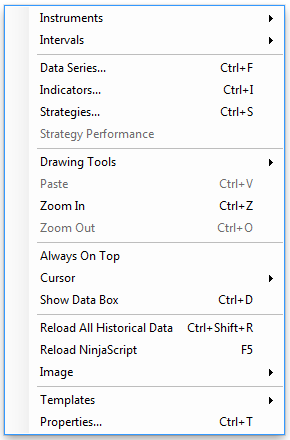
- Left click > Indicators
This will open the following window: (you can also open this window in another way by clicking on the Indicators icon in the NinjaTrader toolbar)
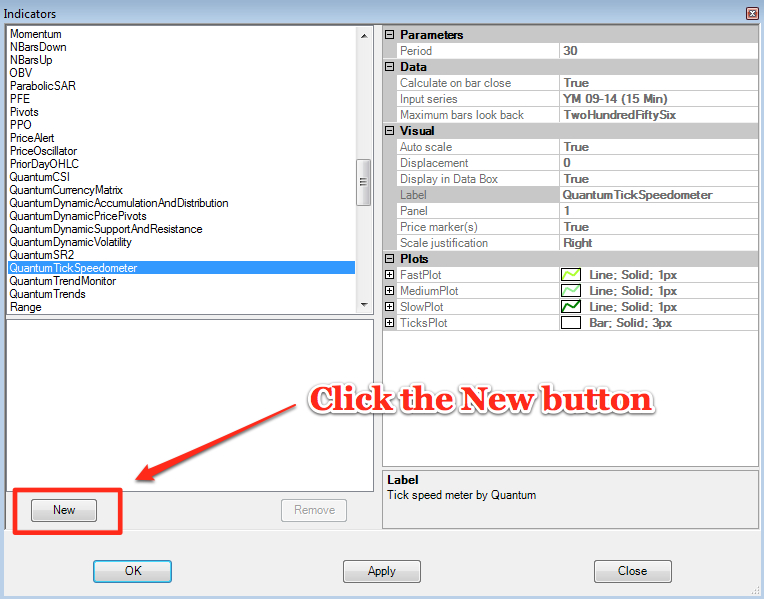
Scroll down to the QuantumTickSpeedometer indicator:
- Left click > This will highlight the indicator in blue
- Left click > ‘New’ button as shown above
This will add the QuantumTickSpeedometer indicator in the box below as shown here:
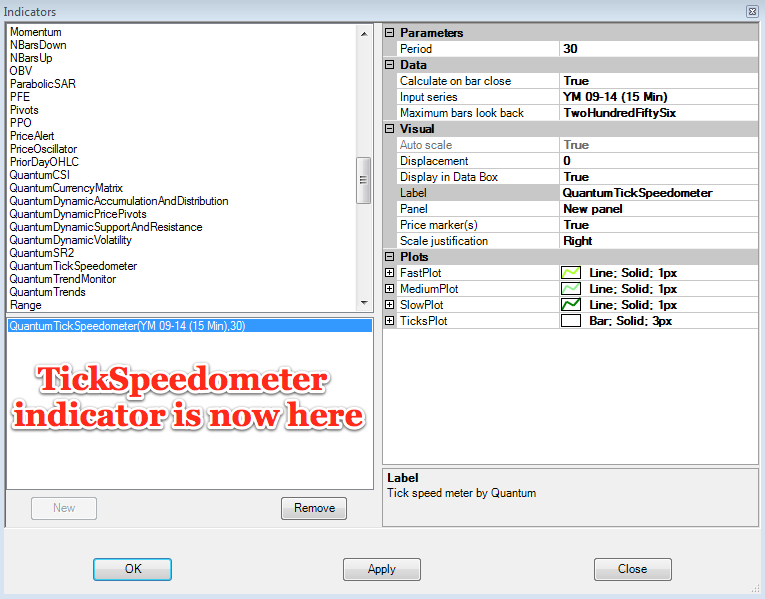
Before clicking the OK or Apply button to complete, the indicator has one or two options which can be configured. You can click the Apply button at any time, and this will apply any changes you have made to the indicator, without closing the window. This will allow you to see the changes you have made, and to modify again before closing with the OK button, or the Close button.
All of the user configuration is done on the right hand side of the above screen, which is shown enlarged below. These are the default settings when you first install the indicator to a chart.

Parameters
These are the Parameters inputs:
Period – this is the number of bars the indicator processes to calculate the relative speed or rate of incoming ticks in a given timeframe. The default is 30. You can change this if you wish, but please do bear in mind, that any increase will also increase the processing load on the indicator, and may slow it down as a result.
- Left click on the Period label, and then left click in the value field. Use the back space to remove or edit the setting, and enter a new number to increase or decrease the period.
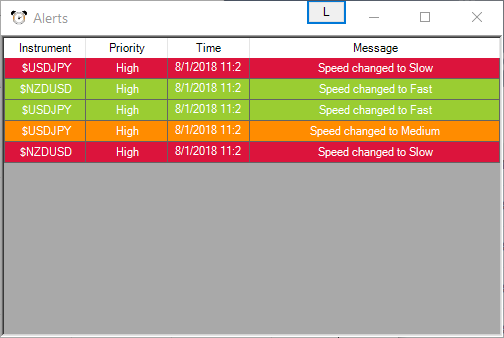
AlertOnSpeedChange – When this property is ticked, the indicator sends alerts to inform the user that the tick speed has changed whether it becomes Slow, Medium or Fast. All alerts can be found in the NinjaTrader Alerts window.
Data
These are the Data inputs:
Calculate on bar close – please DO NOT change this setting and leave as the default of True
Input series – this shows the timeframe for the indicator and will be displayed according to the chart time. In this case the indicator was attached to a 15 minute chart for the YM Emini index
Maximum bars look back – this is the maximum number of bars in the look back for the indicator. We suggest you leave this as the default of TwoHundredFiftySix as it is memory friendly
Visual
These are the Visual inputs:
Auto Scale – DO NOT change this setting and leave this as the default of True
Displacement – DO NOT change this setting and leave this at the default of 0
Display in Data Box – we suggest you leave this at the default of True
Label – this is the label which will display on the chart once the indicator is attached. You can remove this if you wish as follows:
- Place your mouse on the Label label, and left click. This will highlight Label in blue. Left click in the value field alongside and your cursor will appear. Delete the text using the back button and when you apply the indicator, the text will no longer be displayed
Panel – this specifies the panel number where the indicator will appear. We suggest you leave this as the default of New Panel
Price Marker(s) – please DO NOT alter this setting and leave as the default of True
Scale Justification – please DO NOT alter this setting and leave as the default of Right
Plots
Please note – the indicator has been designed to use the traffic light system of red, amber and green, and this is used on both the indicator and the traffic lights. These colors cannot be changed.
FastPlot – this has no effect on the indicator
MediumPlot – this has no effect on the indicator
SlowPlot – this has no effect on the indicator
TicksPlot – this specifies the color and style of each tick volume bar on the chart. To change the settings:
- Left click on the TicksPlot label which will then turn blue. Left click on the + icon and the following options will then be displayed:
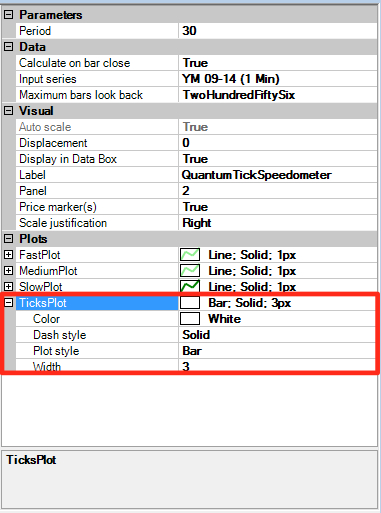
As you can see here, the default setting is a White, Bar Solid and 3px wide. These can be changed as follows:
Color – to change the color left click on the Color label which will turn blue. A drop down arrow will appear in the value field. Left click the drop down arrow and the color options will then be displayed. Use the scroller on the right to select your preferred color which will then appear in the value field alongside.
Dash style – we would recommend the default solid for the tick volume, but you can change this if you prefer. To change the style, left click the Dash style label which will turn blue. A drop down arrow will appear in the value field. Left click the drop down arrow and select your preferred style.
Plot style – we would recommend the default bar for the tick volume, but you can change the style if you prefer. To change the style, left click on the Value label which will turn blue. A drop down arrow will appear in the value field. Left click the drop down arrow and the plot style options will then be displayed. Use the scroller on the right to select your preferred style which will then appear in the value field alongside
Width – to change the size of the pivot, left click on the Width label which will turn blue. Left click the value field alongside and use the back space key to delete the existing value, and replace with a new value. The default is 5px, and any number higher than this will then increase the size of the pivot, whilst a lower number will decrease the size of the pivot. You do not need to enter ‘px’ after the number. Simply enter a whole number to change the size of the pivot to your preferred appearance
Once you have made all the changes to the settings for the Quantum Tick Speedometer indicator left click the OK button to complete and update the indicator.
Changing timeframes
IMPORTANT NOTE
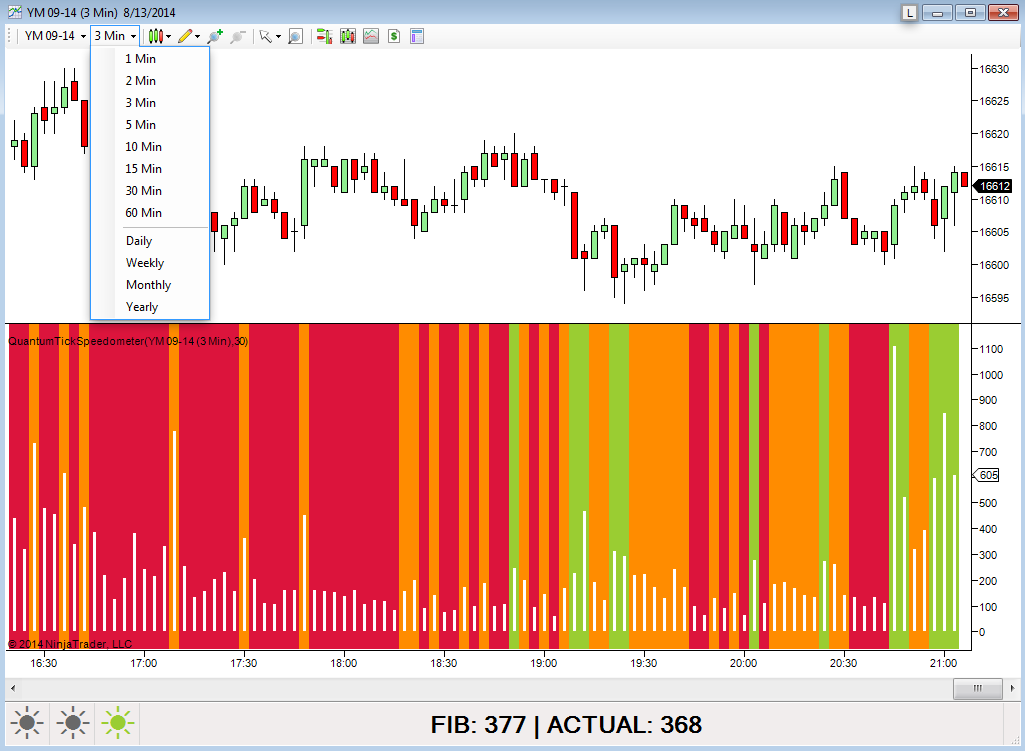
The Quantum Tick Speedometer indicator has been designed to work on time based charts, converting these dynamically to their tick equivalents for all markets. The NinjaTrader platform offers you two primary ways to change timeframes, either from the drop down menu, or using the Data Series option. However, it is important to understand that the indicator will only work when the timeframe is specified in minutes. The daily, weekly, monthly and yearly selections offered in the drop down menu will not work with the indicator. If you do wish to use these very long timeframes, they will need to be specified in minutes, but please be aware of the data load required, which will take some time, and during trading hours, this will also be restricted by NinjaTrader in order to ensure their servers are not overloaded with data requests.
Using the Data Series option to change timeframes
The Data Series option can be accessed in two ways, either by clicking on the data series icon in the toolbar, or right click on the chart and select Data Series from the pop up menu. The following window will then be displayed:
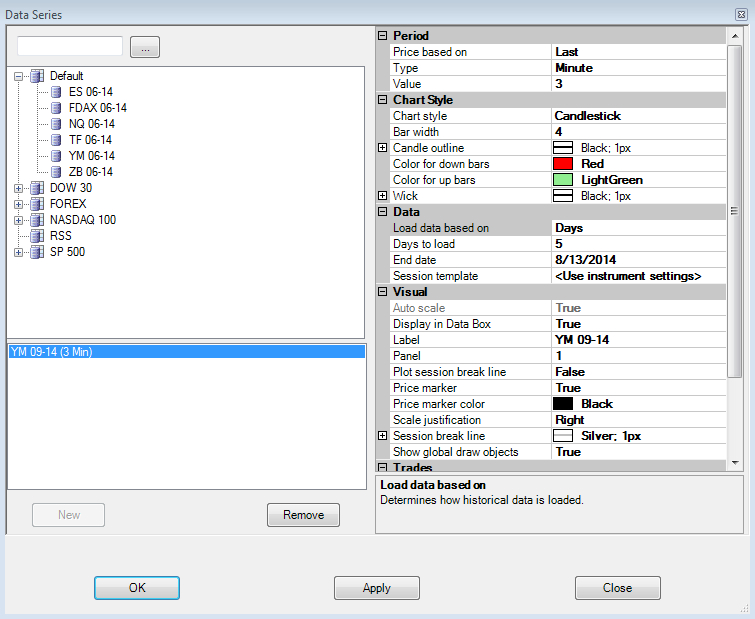
The timeframe for the chart and the indicator is changed in the Period setting at the top of the window as follows:
- Left click the Value label which will then turn blue
- Left click in the Value field and delete the current number and replace with another. To change from 3 to 5 minutes, simply delete the number 3 and replace with the number 5. When applied to the chart this will then change the timeframe from 3 minutes to 5 minutes.
Finally, please note that the default setting under the Data – ‘Days to Load’ option is 5. This is more than sufficient for fast timeframes of a few minutes and indeed can be reduced to 1 or 2 days for very fast timeframes such as 1 minute or 5 minutes. This will also help to speed the loading process and reduce the load on the NinjaTrader servers. As you move to the slower timeframes such as 15 minute and up to 60 minutes and beyond, you will need to increase the days to load accordingly. To change the Days to Load from one setting to another:
- Left click the Days to Load label which will then turn blue
- Left click in the value field and delete the current number and replace with another. To change from 5 days to 1 day, simply delete the number 5 and replace with the number 1. When applied to the chart this will then change the number of days to load from 5 to 1
Removing the indicator
These are the steps to remove a NinjaTrader indicator from a chart:
Right click on the chart and then left click on Indicators from the pop up menu. Scroll down to the indicator you wish to remove and left click which will turn the indicator blue. This will then display the indicator window with its settings as shown below:
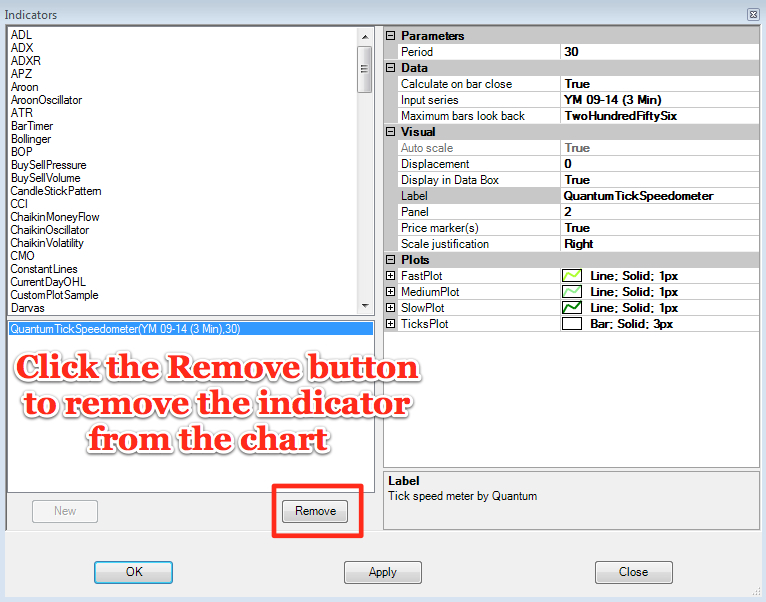
Simply left click on the Remove button as shown above, and the indicator will disappear from the list of indicators on the chart. To confirm left click the OK button to confirm and close the window.


